NA-MIC-kit-curriculum/Testing-Based Programming/How to run Code Coverage
Contents
Introduction
Overview
This tutorial shows how to run Code Coverage in your project.
Code coverage is a mechanism for counting the number of lines of code that are exercised during the execution of your tests.
Prerequisite
You should read first the tutorial:
You should also have installed the package
gcov
this is usually installed along with your gcc package
Configuring the Test
In the project that you built in the previous tutorial, do
 cd ${BINARY_DIR}
 make edit_cache
Enable Debug
Then search for the variable
CMAKE_BUILD_TYPE
and set it to the word "Debug"
Set Coverage Options
- Pass to the advanced mode by hitting the "t" key
- Hit the "/" key in order to start a search
- Type CXX_FLAGS
- Hit the ENTER key to start editing the flags
- add the following test: -g -O0 -fprofile-arcs -ftest-coverage
- Hit the ENTER key to exit editing
- Hit the "/" key in order to start a search
- Type C_FLAGS
- Hit the ENTER key to start editing the flags
- add the following test: -g -O0 -fprofile-arcs -ftest-coverage
- Hit the ENTER key to exit editing
- Hit the "c" key to configure
- Hit the "g" key to generate and quit
Running the Test
Two methods are presented here for running the tests and gathering code coverage information.
The first method is best suited for being used with a CDash Dashboard.
The second method is practical for being run locally, without the need submitting to a Dashboard, or even the need of having a network connection.
Method 1
In order to run the tests that generate code coverage you can do the following
  cd ${BINARY_DIR}
  make Experimental
The final output will look like:
  Site: macondo
  Build name: Linux-g++-4.4
  Performing coverage
  Processing coverage (each . represents one file):
  .
  Acumulating results (each . represents one file):
   .
       Covered LOC:         6
       Not covered LOC:     0
       Total LOC:           6
       Percentage Coverage: 100.00%
   Built target ExperimentalCoverage
Method 2
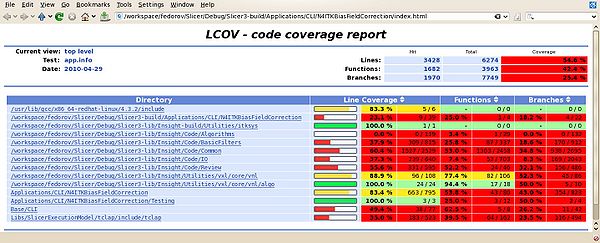
You can also generate a local detailed report of code coverage by doing the following
Install lcov
In Debian and Ubuntu you can install it as a package:
sudo apt-get install lcov
You can also get the source code directly from the Linux Testing Project (LTP)
http://ltp.sourceforge.net/coverage/lcov.php
Create a Script
You could put the following test in a shell script file, to be named for example "computeCoverageLocally.sh"
  #!/bin/zsh
  make
  lcov --directory . --zerocounters
  ctest
  lcov --directory . --capture --output-file app.info
  genhtml app.info
  firefox ./index.html
then add execution permmissions to the script
chmod +x computeCoverageLocally.sh
and copy it in the ${BINARY_DIR}
Run the Script
   cd ${BINARY_DIR}
   ./computeCoverageLocally.sh
this should
- run "make" and recompile any recent changes,
- run the tests
- gather coverage information
- generate a set of HTML pages with the summary
- open the top HTML page in firefox
Running Code Coverage for Individual Slicer Tests
Use the convenience script provided with Slicer, and pass the name of the test of interest as follows:
Slicer3-build/Scripts/computeCodeCoverageForOneTest.sh N4ITKBiasFieldCorrectionTest
The script will generate a hierarchy of html pages with the report results:

