Difference between revisions of "CIP and Nipype"
From NAMIC Wiki
| Line 1: | Line 1: | ||
| − | |||
<gallery> | <gallery> | ||
Image:PW-2015SLC.png|[[2015_Winter_Project_Week#Projects|Projects List]] | Image:PW-2015SLC.png|[[2015_Winter_Project_Week#Projects|Projects List]] | ||
| + | [[File:labeledCT.png]]__NOTOC__ | ||
</gallery> | </gallery> | ||
| Line 18: | Line 18: | ||
* Define and implement a set of workflows for the following tasks: | * Define and implement a set of workflows for the following tasks: | ||
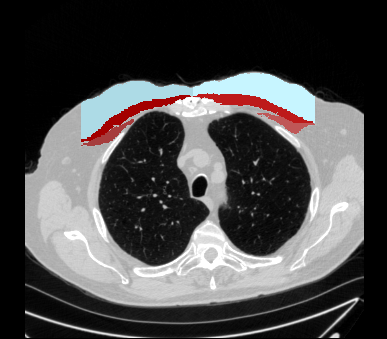
** computing body composition (ex pectoralis muscles, subcutaneous fat, visceral fat, paravertebral muscles...) phenotypes from pre-labeled CT data. The phenotypes consist of cross sectional areas of each label and CT intensity statistics within the labeled region | ** computing body composition (ex pectoralis muscles, subcutaneous fat, visceral fat, paravertebral muscles...) phenotypes from pre-labeled CT data. The phenotypes consist of cross sectional areas of each label and CT intensity statistics within the labeled region | ||
| + | [[File:labeledCT.png]] | ||
** computing lung parenchyma phenotypes from CT data | ** computing lung parenchyma phenotypes from CT data | ||
Revision as of 00:01, 4 January 2015
Home < CIP and NipypeKey Investigators
Project Description
Objective
- We now have a suite of CLIs and python scripts for the processing and the analysis of chest images ready to be incorporated in Slicer as part of the Chest Imaging Platform Extension. This week we will be specifically focusing on defining clinically relevant chest image processing workflows that utilize the CLIs and scripts and implementing the workflows in nipype for their deployment in high performance computing environments.
Approach, Plan
- Our first is to generate nipype interfaces from the slicer CLIs and python scripts
- Define and implement a set of workflows for the following tasks:
- computing body composition (ex pectoralis muscles, subcutaneous fat, visceral fat, paravertebral muscles...) phenotypes from pre-labeled CT data. The phenotypes consist of cross sectional areas of each label and CT intensity statistics within the labeled region
- computing lung parenchyma phenotypes from CT data

