Difference between revisions of "File:Salatneuroimage09fig1.png"
(Fig. 1. Tissue sampling method. A. Gray matter was sampled 35% through the total cortical thickness (blue surface; between 1 and 2 mm normal to the gray/white border (orange surface)), and white matter was sampled at a constant distance of 1 mm (green sur) |
(No difference)
|
Latest revision as of 17:56, 20 October 2009
Fig. 1. Tissue sampling method. A. Gray matter was sampled 35% through the total cortical thickness (blue surface; between 1 and 2 mm normal to the gray/white border (orange surface)), and white matter was sampled at a constant distance of 1 mm (green surface). This conservative sampling procedure assured that most measures were obtained from neighboring voxels, or voxels separated by one to two voxels in between. B. An example of an older adult with low contrast (left) and an older adult with high contrast (right) in the same region. C. Mean maps of signal intensities and GWR in young adults demonstrate the variation in these measures across the surface of the cortex.
File history
Click on a date/time to view the file as it appeared at that time.
| Date/Time | Thumbnail | Dimensions | User | Comment | |
|---|---|---|---|---|---|
| current | 17:56, 20 October 2009 | 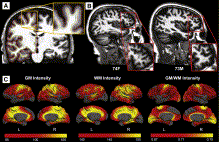 | 219 × 142 (28 KB) | Melonakos (talk | contribs) | Fig. 1. Tissue sampling method. A. Gray matter was sampled 35% through the total cortical thickness (blue surface; between 1 and 2 mm normal to the gray/white border (orange surface)), and white matter was sampled at a constant distance of 1 mm (green sur |
- You cannot overwrite this file.
File usage
The following page uses this file: