Difference between revisions of "File:Vtk-charts-chemdata-graphs.png"
From NAMIC Wiki
(Example of linked selection using a scatter plot (top-left), parallel coordinates (top-right) controlling selection, and a second scatter plot showing a subset of the data (bottom).) |
(No difference)
|
Latest revision as of 19:12, 17 June 2011
Example of linked selection using a scatter plot (top-left), parallel coordinates (top-right) controlling selection, and a second scatter plot showing a subset of the data (bottom).
File history
Click on a date/time to view the file as it appeared at that time.
| Date/Time | Thumbnail | Dimensions | User | Comment | |
|---|---|---|---|---|---|
| current | 19:12, 17 June 2011 | 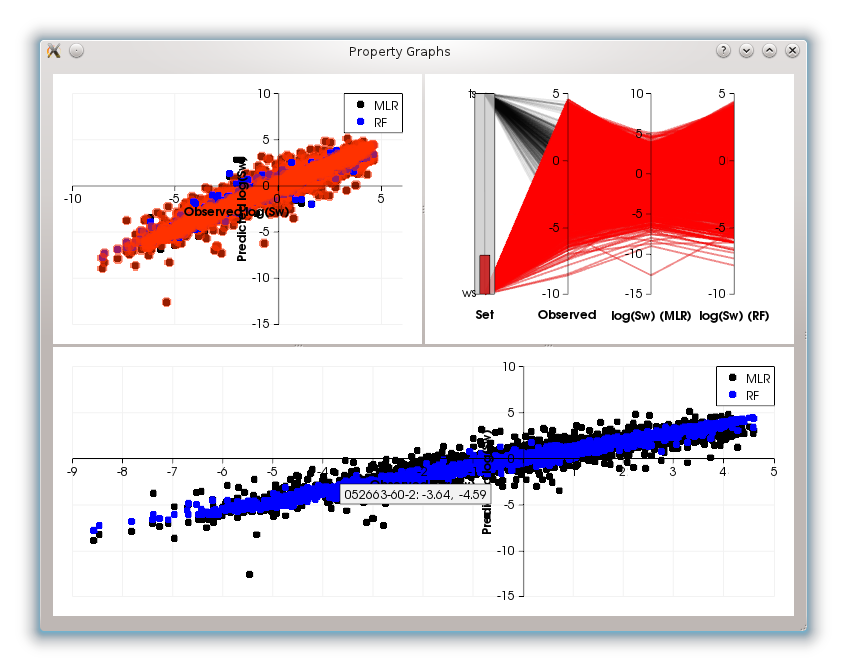 | 847 × 671 (88 KB) | Marcus.hanwell (talk | contribs) | Example of linked selection using a scatter plot (top-left), parallel coordinates (top-right) controlling selection, and a second scatter plot showing a subset of the data (bottom). |
- You cannot overwrite this file.
File usage
The following page uses this file: