Difference between revisions of "Projects:ShapeBasedSegmentationAndRegistration"
| (14 intermediate revisions by 5 users not shown) | |||
| Line 1: | Line 1: | ||
| − | Back to | + | Back to [[Algorithm:MIT|MIT Algorithms]] |
__NOTOC__ | __NOTOC__ | ||
= Shape Based Segmentation and Registration = | = Shape Based Segmentation and Registration = | ||
| Line 5: | Line 5: | ||
Standard image based segmentation approaches perform poorly when there is little or no contrast along boundaries of different regions. In such cases segmentation is mostly performed manually using prior knowledge of the shape and relative location of the underlying structures combined with partially discernible boundaries. We present an automated approach guided by covariant shape deformations of neighboring structures, which is an additional source of prior knowledge. Captured by a shape atlas, these deformations are transformed into a statistical model using the logistic function. The mapping between atlas and image space, structure boundaries, anatomical labels, and image inhomogeneities are estimated simultaneously within an Expectation-Maximization formulation of the Maximum A posteriori Probability (MAP) estimation problem. These results are then fed into an Active Mean Field approach, which views the results as priors to a Mean Field approximation with a curve length prior. | Standard image based segmentation approaches perform poorly when there is little or no contrast along boundaries of different regions. In such cases segmentation is mostly performed manually using prior knowledge of the shape and relative location of the underlying structures combined with partially discernible boundaries. We present an automated approach guided by covariant shape deformations of neighboring structures, which is an additional source of prior knowledge. Captured by a shape atlas, these deformations are transformed into a statistical model using the logistic function. The mapping between atlas and image space, structure boundaries, anatomical labels, and image inhomogeneities are estimated simultaneously within an Expectation-Maximization formulation of the Maximum A posteriori Probability (MAP) estimation problem. These results are then fed into an Active Mean Field approach, which views the results as priors to a Mean Field approximation with a curve length prior. | ||
| − | = EM-Based Shape Segmenter = | + | == EM-Based Shape Segmenter == |
{| | {| | ||
| Line 58: | Line 58: | ||
|} | |} | ||
| − | = Active Mean Field (AFM) = | + | == Active Mean Field (AFM) == |
| + | |||
The approach estimates the posterior probability of | The approach estimates the posterior probability of | ||
tissue labels. Conventional likelihood models are combined with a | tissue labels. Conventional likelihood models are combined with a | ||
| Line 133: | Line 134: | ||
= Key Investigators = | = Key Investigators = | ||
| − | * MIT | + | * MIT: K.M. Pohl, S. Bouix, M. Shenton, R. Kikinis, and W.M. Wells |
= Publications = | = Publications = | ||
| + | ''In Print'' | ||
| − | + | * [http://www.na-mic.org/publications/pages/display?search=Projects%3AShapeBasedSegmentationAndRegistration&submit=Search&words=all&title=checked&keywords=checked&authors=checked&abstract=checked&sponsors=checked&searchbytag=checked| NA-MIC Publications Database on Shape Based Segmentation and Registration] | |
| − | + | [[Category: Shape Analysis]] [[Category: Registration]] [[Category: Segmentation]] [[Category:MRI]] | |
Latest revision as of 20:19, 11 May 2010
Home < Projects:ShapeBasedSegmentationAndRegistrationBack to MIT Algorithms
Shape Based Segmentation and Registration
Standard image based segmentation approaches perform poorly when there is little or no contrast along boundaries of different regions. In such cases segmentation is mostly performed manually using prior knowledge of the shape and relative location of the underlying structures combined with partially discernible boundaries. We present an automated approach guided by covariant shape deformations of neighboring structures, which is an additional source of prior knowledge. Captured by a shape atlas, these deformations are transformed into a statistical model using the logistic function. The mapping between atlas and image space, structure boundaries, anatomical labels, and image inhomogeneities are estimated simultaneously within an Expectation-Maximization formulation of the Maximum A posteriori Probability (MAP) estimation problem. These results are then fed into an Active Mean Field approach, which views the results as priors to a Mean Field approximation with a curve length prior.
EM-Based Shape Segmenter
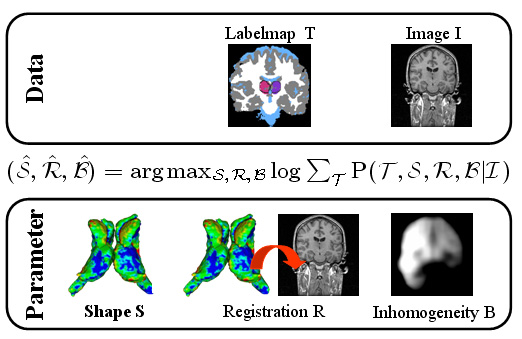
| The Bayesian framework models the relationship between the observed data I (input image), the hidden data T (label map), and the parameter space (S,R,B) with shape model S, registration parameters R, and image inhomogeneities B. The optimal solution with respect to (S,R,B) is defined by the MAP estimate of the framework. We iteratively determine the solution of the estimation problem using an Expectation Maximization (EM) implementation. The E-Step calculates the ‘weights’ for each structure at voxel x. The M-Step updates the approximation of (S,B,R). |
Shape Atlas
|
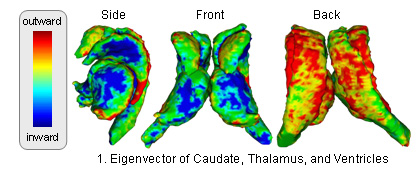
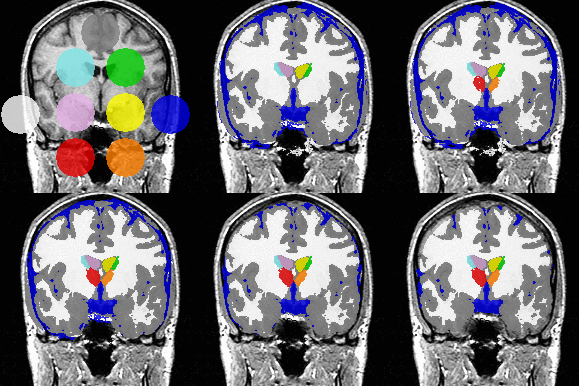
The atlas captures shapes by the signed distance map representation and covariation of the shapes across structures through Principle Component Analysis (PCA). The atlas is constructed through the following method (see [1] for further detail: )
|
Registration Model
| The hierarchical registration framework represents the correspondence between the coordinate system of the atlas, which defines the shape model, and the MR image. The structure-independent parameters capture the correspondence between atlas and image space. The structure dependent parameters are the residual structure-specific deformations not adequately explained by the structure-independent registration parameters. |
Image Inhomogeneity Model
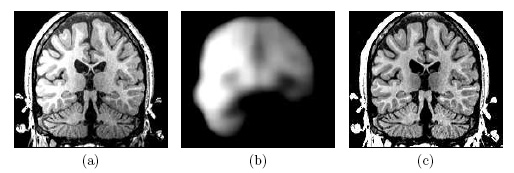
| Image (a) shows an MR image corrupted by image inhomogeneities, noise, partial voluming and other image artifacts. The image inhomogeneities of (a) are shown in (b). Unlike noise, image inhomogeneities are characterized by a slowly varying values within the brain. Image (c) is as image inhomogeneity corrected MR image of (a). In our method, inhomogeneities are modeled as a Gaussian distribution over the image space. As Wells et al. [2] shows the inhomogeneity can then be approximated by the product between a low pass filter represented as a matrix and the weighted residual between estimated and observed MR image. |
Experiement of 22 Cases
|
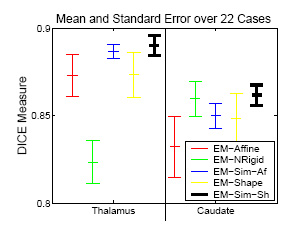
The experiment empirically demonstrates the utility of joining registration and shape based segmentation in an EM implementation by comparing the accuracy our new method with (EM-Sim-Sh) to three other EM implementations:
All methods segment 22 cases into the three brain tissue classes as well as the ventricles, thalamus, and caudate. We then measure the overlap between manual and automatic segmentations of the thalamus and caudate using DICE. Only our new approach (EM-Sim-Sh) performs well for both structures. |
Active Mean Field (AFM)
The approach estimates the posterior probability of tissue labels. Conventional likelihood models are combined with a curve length prior on boundaries, and an approximate posterior distribution on labels is sought via the Mean Field approach. Optimizing the resulting estimator by gradient descent leads to a level set style algorithm where the level set functions are the logarithm-of-odds encoding of the posterior label probabilities in an unconstrained linear vector space. Applications with more than two labels are easily accommodated. The label assignment is accomplished by the Maximum A Posteriori rule, so there are no problems of 'overlap' or 'vacuum'. We test the method on synthetic images with additive noise. In addition, we segment a magnetic resonance scan into the major brain compartments and subcortical structures.
LogOdds Maps
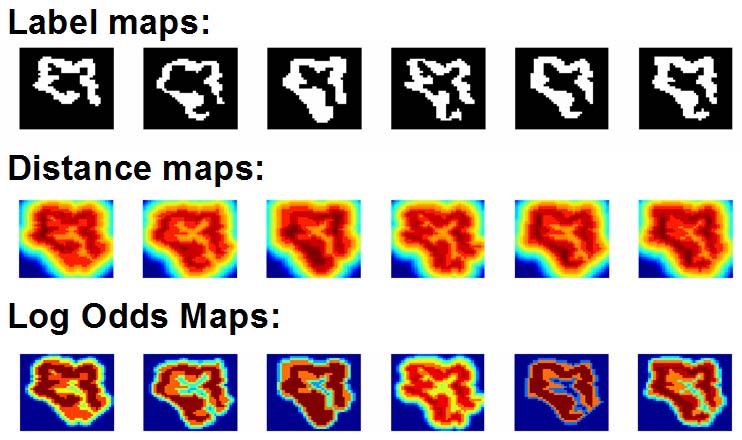
LogOdds Map relate to the certainty of objects’ boundaries in images. Like sign distance maps, LogOdds encode the boundary of the shape via a zero-level set that now represents the set of voxels with the highest uncertainty of being assigned to fore- or background. Unlike sign distance maps, the rest of the space is defined by the logarithm of the odds of a structure to be present at that location under the assumption that voxels in an image are independently distributed and the training set consists of aligned segmentations. This relationship with the odds of the presence of an anatomical label provides a natural way to capture boundary uncertainty. Importantly, the space of LogOdds is closed under addition and scalar multiplication, and as such it can be used for efficient and straightforward statistical modeling and inference of shape.
The figure below shows the LogOdds maps generated from label maps of six experts segmenting the right superior temporal gyrus. Dark blue and dark red indicates high certainty that the voxel is assigned to the background and foreground respectively. All other colors represent statistical uncertainty about the assignment of the voxel.
'The AFM Algorithm' We now combine the Mean Field approximation with the level set framework by using the LogOdds parametrization. We do so by embedding the Mean Field parameters into the LogOdds space. We then determine the optimal parameters via gradient descent which we is realized in the level set formulation. This results in the AMF algorithm which computes space conditioned probabilities while incorporating regional as well as boundary properties of objects.
'Results'
We now discuss the curve evolution of our algorithm on a noisy image that was segmented by a Gaussian classifier into a fragmented label map. The corresponding probability maps are the inputs to our algorithm, which robustly identifies the boundary of the structure. We initialize our curve evolution with the distance map of a small circle (see green circle in top, left image and distance map below) and the input is the noisy LogOdds map of the normalized likelihood (bottom, right). The initial curve is disconnected from the square forcing our method to split the zero-level set into two separate curves by Iteration 1. The circle connected to the square is expanding while the other curve is shrinking. Our curve evolution further evolves both curves until the connected curve converges to the shape of the square and the disconnected curve vanishes. The evolution produces the LogOdds maps shown in the bottom row of Figure 1. Initially, the dark blue region shrinks, i.e. the number of voxels with high certainty about the presence of the square is decreasing. The shrinking is due to the discrepancy between the initial LogOdds map and the input label likelihoods. As the method progresses, the blue region assimilates towards the predefined LogOdds map. Unlike the segmentation produced through thresholding the initial likelihoods, our level set method filters out the noise. The final LogOdds map is smooth and the binary map shows the square as one connected region.
The second experiment includes real MRI images, in which AMF automatically segments the major brain compartments as well as subcortical structures. Due to the LogOdds parametrization, our method naturally evolves families of curves.
'Software'
The algorithm is currently implemented in 3D Slicer Version 2.6 and a beta version is available in 3D Slicer Version 3.
Key Investigators
- MIT: K.M. Pohl, S. Bouix, M. Shenton, R. Kikinis, and W.M. Wells
Publications
In Print
