Home < Meningioma growth modeling with TumorSimThis is a follow-up project for Meningioma growth simulation project within 2009 Boston programming week project.
tumorsim1.1rc2 experiments
Seed 1 (default)
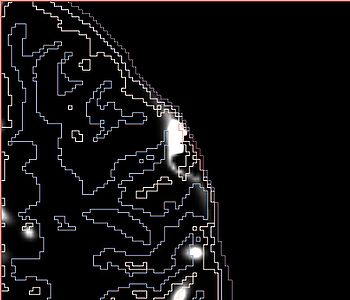
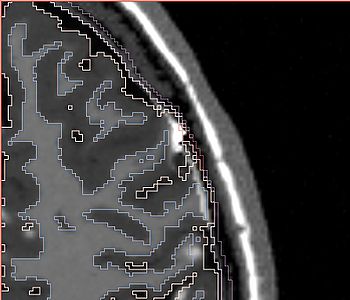
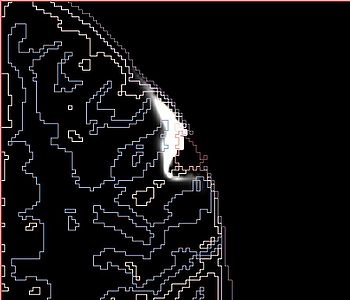
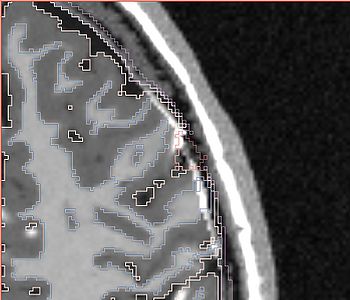
NOTE: red outlines the boundary of the label corresponding to the initial tumor seed!
<flash>file=Seed_1_simulation.swf|width=1000|height=800|quality=best</flash>
Seed 3 (ventricle)
<flash>file=Seed_3_simulation.swf|width=1000|height=800|quality=best</flash>
tumorsim1.1.rc4 experiments
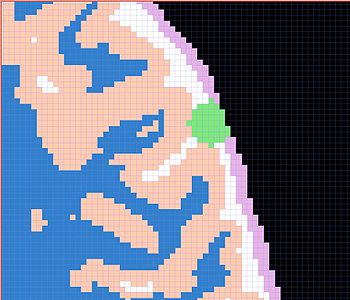
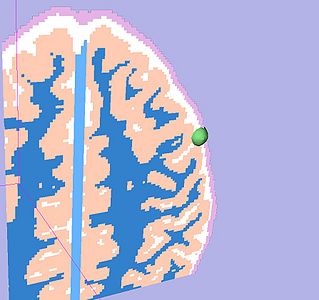
| All the following experiments are based on the "thin dura" input labels, and the tumor seed image shown on the right. The tumor label is shown in green color.
|
|
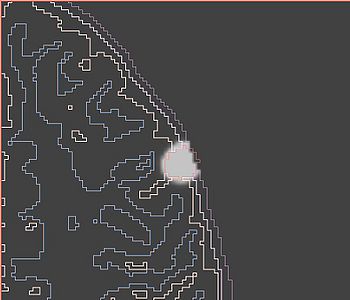
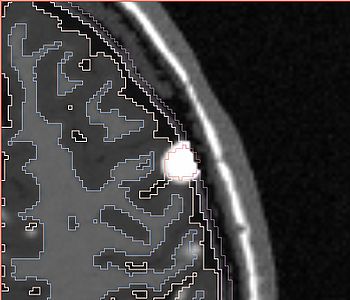
The following screenshots capture the same slice of the following images in order: (1) image containing the tumor probabilities, and (2) the simulated Gad enhanced image.
| Poisson ratio 0.5 (initial value)
|
|
| Poisson ratio 0.4 (initial value)
|
|
| Poisson ratio 0.2 (initial value)
|
|
