Projects:RegistrationDocumentation:Evaluation
Contents
Visualizing Registration Results
Below we discuss different forms of evaluating registration accuracy. This is not a straightforward assessment, be it qualitative or quantitative, and the requirements for evaluating registration differ with the type of input data and the questions asked.
Animated GIFs
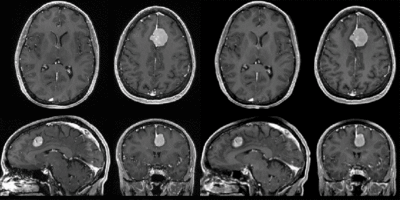
Relatively small differences can be detected, albeit qualitatively, with a quick switching between the two images.
Color Composite
We feed the two images into the R,G or B channel of a true color image and thus create
Checkerboard
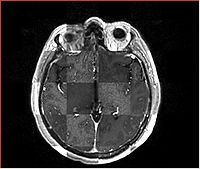
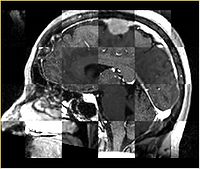
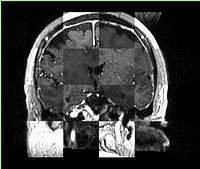
Builds a "puzzle-piece" collage of blocks from both images, alternating between the two. Helpful if the two images are from different modality or have different contrast. Continuity of edges becomes very apparent on such images.
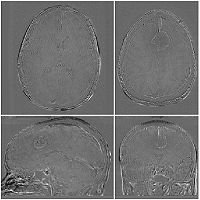
Subtraction Images
For intra-subject and intra-modality images only. The pixel-by pixel difference of the registered image pair can provide valuable information about registration quality. This usually requires at least global intensity matching to compensate for overall brightness and contrast differences.
Fiducial Pairs
To the extent that we can reliably identify anatomical landmarks in both images, we can use the residual distance of those landmarks after registration as a metric for registration accuracy. The most common problem with this approach is that (esp. for 3D images) the identification of landmarks is often already less than the registration accuracy we want to measure. This limitation is less of an issue when comparing different registrations to eachother.
Label Maps
If we have segmented structures in both images, we can use them to evaluate accuracy also. Often this is corroborated by true change, however, i.e. we face the difficult task of discriminating true anatomical change from residual misalignment.
