2015 Summer Project Week:Astronomy
Key Investigators
- Davide Punzo, Kapteyn Astronomical Institute, University of Groningen, Netherlands
- anyone interested is very welcome
Project Description
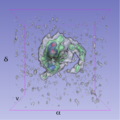
Upcoming HI (neutral Hydrogen) surveys will deliver large datasets, and automated processing using the full 3-D information (two positional dimensions and one spectral dimension) to find and characterize HI objects is imperative. In this context, visualization is an essential tool for enabling qualitative and quantitative human control on an automated source finding and analysis pipeline. Visual Analytics, the combination of automated data processing and human reasoning, creativity and intuition, supported by interactive visualization, enables flexible and fast interaction with the 3-D data, helping the astronomer to deal with the analysis of complex sources. 3-D visualization, coupled to modeling, provides additional capabilities helping the discovery and analysis of subtle structures in the 3-D domain.
gas component of WEIN069
APERTIF future daily observation
Objective
- proper visualization of astronomical data cubes: using data astronomical data formats, such as FITS (http://en.wikipedia.org/wiki/FITS), and astronomical world coordinates system (WCS);
- generation of flux density profiles, moment maps and position-velocity diagrams linked with the 3-D view;
- enabling interactive smoothing in all three dimensions and multiscale analysis, such as wavelet lifting;
- interactive 3-D selection of HI sources;
- interactive HI data modeling coupled to visualization;
- introduction of the SAMP protocol (Simple Application Messaging Protocol) to enable interoperability with Topcat, and other VO (virtual observatory) tools and catalogs.
Approach, Plan
- finish the first objective;
Progress:
- VTK_FITS reader (and writer) and the Slicer AstroVolume module done; working on VTK_WCS_transformation.
outcome from 1st day: coordinates, labels and units.
- data probe coordinates: factorize getPixelString in the logic of the volumes;
- ruler widget: takes units properly -> OK;
- text on slices view: takes units properly -> OK;
- "spacing annotation" (horizontal widget showing the physical spacing): problem, makeScalingRuler method is hardcoded with mm and cm. Moreover we'd like a different design (kvis example http://www.atnf.csiro.au/computing/software/karma/tool-screen-snapshots/kvis.gif)-> is factoring the class vtkPVScalarBarActor in the logic of the volumes a solution?;
- units: we have different unit for the third axes and we have also units for flux (pixel intensity), how to handle these?;
- 3-D labels: is it possible a customization (LEFT->EAST and so on)?;
- question on AstroVolume and wcs: AstroVolume module allocates a vtkMRMLScalarVolumeNode, therefore I am adding the *wcs (it is a struct) in the vtkMRMLAstroVolumeStorageNode. Is this adequate? or it is better to do a vtkMRMLAstroVolumeNode child of vtkMRMLScalarVolumeNode and store the *wcs there (in this case it is not possible to use anymore CLI modules, but allows a better infrastructure)?
