Difference between revisions of "2009 Summer Project Week Statistical Toolbox"
| (14 intermediate revisions by 2 users not shown) | |||
| Line 1: | Line 1: | ||
__NOTOC__ | __NOTOC__ | ||
<gallery> | <gallery> | ||
| − | Image:PW2009-v3.png|[[2009_Summer_Project_Week|Project Week Main Page]] | + | Image:PW2009-v3.png|[[2009_Summer_Project_Week#Projects|Project Week Main Page]] |
| + | Image:Blender_Brain_Mesh.jpg|Brain mesh with cortical thinning information | ||
| + | Image:Ventricles_001_axial.png|Axial view of a T-test ventricular enlargement in Alzheimer's disease | ||
| + | Image:Ventricles_001_sagital.png|Sagital view of a T-test ventricular enlargement in Alzheimer's disease | ||
| + | Image:TvsNormal.jpg|Critical thresholds for T distributions with different degrees of freedom compared to the normal distribution | ||
</gallery> | </gallery> | ||
| Line 7: | Line 11: | ||
==Key Investigators== | ==Key Investigators== | ||
| − | * Robarts Research/ | + | * Robarts Research/University of Western Ontario: Diego Cantor |
| − | + | *BWH: Lauren O'Donnell | |
| + | *BWH: Laura Rigolo | ||
<div style="margin: 20px;"> | <div style="margin: 20px;"> | ||
| Line 16: | Line 21: | ||
The objective of this project is to build a statistical toolbox for brain images, and integrate this toolbox into Slicer. Current tools such as SurfStat and SPM allow to run statistical experiments in two levels. The first level corresponds to a single subject study where the progression of a disease, the effect of a drug or the functional activation (fMRI) is analyzed over time. The second level corresponds to cross-sectional studies where multiple subjects are compared using designs such as ANOVA and T-tests in all its varieties. | The objective of this project is to build a statistical toolbox for brain images, and integrate this toolbox into Slicer. Current tools such as SurfStat and SPM allow to run statistical experiments in two levels. The first level corresponds to a single subject study where the progression of a disease, the effect of a drug or the functional activation (fMRI) is analyzed over time. The second level corresponds to cross-sectional studies where multiple subjects are compared using designs such as ANOVA and T-tests in all its varieties. | ||
| − | The proposal is then to construct a third level where single-subject or multiple-subject experiments can be carried out using information from multiple modalities simultaneously. In such environment, every subject has a set of images(anatomical MR, functional MR, PET data, etc...) and the statistics are taken on vectors. Each vector is composed by the respective intensities in the image | + | The proposal is then to construct a third level where single-subject or multiple-subject experiments can be carried out using information from multiple modalities simultaneously. In such environment, every subject has a set of images(anatomical MR, functional MR, PET data, etc...) and the statistics are taken on vectors. Each vector is composed by the respective intensities in the image sets. |
| + | |||
| + | |||
</div> | </div> | ||
| Line 22: | Line 29: | ||
<h3>Approach, Plan</h3> | <h3>Approach, Plan</h3> | ||
| − | Due to the complexity of this toolbox the plan is to break it down in several releases or milestones. | + | Due to the complexity of this toolbox the plan is to break it down in several releases or milestones. |
| − | < | + | In general terms I plan to use: |
| + | * TinyXML for the XML processing | ||
| + | * VNL (the one available in ITK) for matrices processing | ||
| + | * Boost shared pointers for smart pointers | ||
| + | * <strike>Some undetermined thread library for asynchronous processing (linear regression stuff...)</strike> | ||
| + | Update: Use [http://www.nvidia.com/object/cuda_home.html CUDA] for simultaneous | ||
| + | linear regression processing | ||
| + | |||
| + | Any suggestion to change these libraries is more than welcome. | ||
| + | |||
| + | '''First Milestone''' | ||
* The images should be spatially normalized and registered to an atlas | * The images should be spatially normalized and registered to an atlas | ||
* The experiments are read/written using XML | * The experiments are read/written using XML | ||
| Line 34: | Line 51: | ||
* The integration with Slicer is resolved | * The integration with Slicer is resolved | ||
| − | + | '''Second Milestone''' | |
* Summary statistics are available (Global/local) | * Summary statistics are available (Global/local) | ||
* Extent threshold is available | * Extent threshold is available | ||
| Line 41: | Line 58: | ||
* Likelihood Ratio Test is available | * Likelihood Ratio Test is available | ||
| − | + | '''Third Milestone''' | |
* Precalculated T-maps and F-maps can be compared | * Precalculated T-maps and F-maps can be compared | ||
* Global and local statistic plots are available | * Global and local statistic plots are available | ||
* Confidence intervals for the mean are available | * Confidence intervals for the mean are available | ||
| − | + | '''Fourth Milestone''' | |
* Principal Component Analysis is available | * Principal Component Analysis is available | ||
</div> | </div> | ||
| Line 53: | Line 70: | ||
<h3>Progress</h3> | <h3>Progress</h3> | ||
| + | This is a long-term project. Right now I am working on the first milestone. I expect to learn about the Slicer architecture (modules, gui, event handling, processing threads, etc..) during the week so the posterior releases are developed entirely into Slicer. | ||
| + | June 26th/09 | ||
| + | == Progress during programming week== | ||
| + | * Kick-off of the collaboration with '''Dr. Alexandra Golby's''' group at Brigham and Women's Hospital. Dr. Golby's group is going to provide me with test multimodal images for the statistical toolbox. | ||
| + | * Kick-off of the collaboration with '''Vidya Rajagopalan''' from Virginia Tech. Vidya has work with multivariate statistics during her PhD and she is acquainted with current Tensor-based and Voxel-based morphometry techniques and applications. During the programming week we had really interesting conversations and exchange of ideas on these techniques. I am taking Vidya's recommendations and code into the statistical toolbox. | ||
| + | * I had a really good technical session with '''Joe Stam''' from NVIDIA. After discussing my project he made very important recommendations on the way to layout the memory on the GPU in order to maximize the throughput. | ||
| + | |||
| + | * I learn how to use the python shell in Slicer. '''Demian Wasserman''' from BHW/INRIA was really helpful. He helped me to have it up and running. | ||
</div> | </div> | ||
</div> | </div> | ||
| Line 62: | Line 87: | ||
==References== | ==References== | ||
| − | + | * http://www.fil.ion.ucl.ac.uk/spm/ | |
| − | + | * http://www.math.mcgill.ca/keith/surfstat/ | |
</div> | </div> | ||
Latest revision as of 13:29, 26 June 2009
Home < 2009 Summer Project Week Statistical Toolbox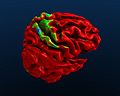
Brain mesh with cortical thinning information
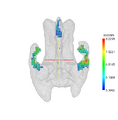
Axial view of a T-test ventricular enlargement in Alzheimer's disease

Sagital view of a T-test ventricular enlargement in Alzheimer's disease

Critical thresholds for T distributions with different degrees of freedom compared to the normal distribution


Key Investigators
- Robarts Research/University of Western Ontario: Diego Cantor
- BWH: Lauren O'Donnell
- BWH: Laura Rigolo
Objective
The objective of this project is to build a statistical toolbox for brain images, and integrate this toolbox into Slicer. Current tools such as SurfStat and SPM allow to run statistical experiments in two levels. The first level corresponds to a single subject study where the progression of a disease, the effect of a drug or the functional activation (fMRI) is analyzed over time. The second level corresponds to cross-sectional studies where multiple subjects are compared using designs such as ANOVA and T-tests in all its varieties.
The proposal is then to construct a third level where single-subject or multiple-subject experiments can be carried out using information from multiple modalities simultaneously. In such environment, every subject has a set of images(anatomical MR, functional MR, PET data, etc...) and the statistics are taken on vectors. Each vector is composed by the respective intensities in the image sets.
Approach, Plan
Due to the complexity of this toolbox the plan is to break it down in several releases or milestones.
In general terms I plan to use:
- TinyXML for the XML processing
- VNL (the one available in ITK) for matrices processing
- Boost shared pointers for smart pointers
Some undetermined thread library for asynchronous processing (linear regression stuff...)
Update: Use CUDA for simultaneous
linear regression processing
Any suggestion to change these libraries is more than welcome.
First Milestone
- The images should be spatially normalized and registered to an atlas
- The experiments are read/written using XML
- Trilinear interpolation is used when the images in the set have different resolutions
- There are not covariates
- The only test available is a T^2 Hotelling test comparing all subjects against the mean
- Uncorrected p-values are available
- When the dimension is 1. The T^2 test is reduced to a regular t-test and this is verifiable
- The integration with Slicer is resolved
Second Milestone
- Summary statistics are available (Global/local)
- Extent threshold is available
- Family-wise p-values are available
- Two-sample T^2 test is available
- Likelihood Ratio Test is available
Third Milestone
- Precalculated T-maps and F-maps can be compared
- Global and local statistic plots are available
- Confidence intervals for the mean are available
Fourth Milestone
- Principal Component Analysis is available
Progress
This is a long-term project. Right now I am working on the first milestone. I expect to learn about the Slicer architecture (modules, gui, event handling, processing threads, etc..) during the week so the posterior releases are developed entirely into Slicer.
June 26th/09
Progress during programming week
- Kick-off of the collaboration with Dr. Alexandra Golby's group at Brigham and Women's Hospital. Dr. Golby's group is going to provide me with test multimodal images for the statistical toolbox.
- Kick-off of the collaboration with Vidya Rajagopalan from Virginia Tech. Vidya has work with multivariate statistics during her PhD and she is acquainted with current Tensor-based and Voxel-based morphometry techniques and applications. During the programming week we had really interesting conversations and exchange of ideas on these techniques. I am taking Vidya's recommendations and code into the statistical toolbox.
- I had a really good technical session with Joe Stam from NVIDIA. After discussing my project he made very important recommendations on the way to layout the memory on the GPU in order to maximize the throughput.
- I learn how to use the python shell in Slicer. Demian Wasserman from BHW/INRIA was really helpful. He helped me to have it up and running.