Difference between revisions of "2011 Winter Project Week:UncertaintyVisualization"
| Line 2: | Line 2: | ||
<gallery> | <gallery> | ||
Image:PW-SLC2011.png|[[2011_Winter_Project_Week#Projects|Projects List]] | Image:PW-SLC2011.png|[[2011_Winter_Project_Week#Projects|Projects List]] | ||
| − | Image: | + | Image:CompositePostOp3.png|Scatter plot of the original FA data through the genu of the corpus callosum of a normal brain. |
| − | Image: | + | Image:fMRIColormapAndQuintiles.png|Regression of FA data; solid line represents the mean and dotted lines the standard deviation. |
</gallery> | </gallery> | ||
| − | ==Registration Uncertainty== | + | ==Visualizing Registration Uncertainty== |
==Key Investigators== | ==Key Investigators== | ||
Revision as of 02:42, 10 December 2010
Home < 2011 Winter Project Week:UncertaintyVisualization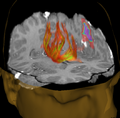
Scatter plot of the original FA data through the genu of the corpus callosum of a normal brain.
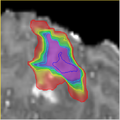
Regression of FA data; solid line represents the mean and dotted lines the standard deviation.


Visualizing Registration Uncertainty
Key Investigators
- SPL: Petter Risholm, William Wells
Objective
We are developing methods for visualizing registration uncertainty.
Approach, Plan
Our approach for summarizing and visualizing registration uncertainty is described in [Risholm 2010].
Our plan for the project week is to incorporate the generation of marginal probability maps as a command line module in Slicer3.
Progress
We have a registration framework which produces uncertainty information. A preliminary VTK class for generating marginal probability maps of deformed objects.
Delivery Mechanism
This work will be delivered to the NA-MIC Kit as a (please select the appropriate options by noting YES against them below)
- ITK Module
- Slicer Module
- Built-in
- Extension -- commandline Yes
- Extension -- loadable
- Other (Please specify)
References
- Risholm P, Samset E, Pieper S, Wells W Summarizing and Visualizing Uncertainty in Non-Rigid Registration. MICCAI 2010