Difference between revisions of "2012 Winter Project Week:Charts"
| Line 42: | Line 42: | ||
<h3>Progress</h3> | <h3>Progress</h3> | ||
Initial ChartNode, ChartViewNode, ChartControllerWidget (placeholder), ChartView, and ChartWidget have been constructed. Charts can be defined in MRML and presented in the ChartView. | Initial ChartNode, ChartViewNode, ChartControllerWidget (placeholder), ChartView, and ChartWidget have been constructed. Charts can be defined in MRML and presented in the ChartView. | ||
| + | |||
| + | SuperBuild support to download jqPlot. | ||
| + | |||
| + | jqPlot packaged within Slicer4 as a Qt Resource | ||
<h3>Progress since Project Week</h3> | <h3>Progress since Project Week</h3> | ||
Revision as of 21:18, 2 February 2012
Home < 2012 Winter Project Week:Charts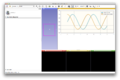
A chart displayed at the end of Project Week.
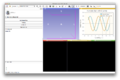
A chart from after Project Week.

A bar chart from after Project Week.


Key Investigators
- GE: Jim Miller, Kedar Patwardhan
- Isomics: Steve Pieper
Objective
Develop a view for charting that can be packed in a Slicer Layout. Charts will be able to display line graphs, bar graphs, histograms, etc.
Approach, Plan
The approach is to model the new view after the SliceViews and ThreeDViews. This requires
- ChartViewNode - one to one with a ChartView
- ChartNode - contains a list to DoubleArrayNodes to display in the chart and contains the chart properties
- ChartWidget - contains a controller and chart view
- ChartViewControllerWidget - popup to control the content and properties of a chart
- ChartView - widget to display the actual chart
We will leverage a Javascript plotting library called jqplot to increase the speed of development. This library will only be used inside the ChartView and will not be exposed to the rest of Slicer. Thus, the whole charting infrastructure will be pure MRML and Qt. Other charting libraries, say VTK, could also be implemented when we need to trade off style and speed.
To use jqplot, the initial ChartView will be a subclass of qWebView.
Progress
Initial ChartNode, ChartViewNode, ChartControllerWidget (placeholder), ChartView, and ChartWidget have been constructed. Charts can be defined in MRML and presented in the ChartView.
SuperBuild support to download jqPlot.
jqPlot packaged within Slicer4 as a Qt Resource
Progress since Project Week
- Chart resizing with window
- Chart properties at the Chart and Array level
- Chart type, show lines, show grid, show legend, title, x-axis label, y-axis label
- Chart types: line and bar
- ChartController to modify parameters
- Chart zooming
- dataPointClicked() signal - Qt signal that fires when user clicks on a data point