Difference between revisions of "2012 Winter Project Week: Continuous 4D shapes"
Jfishbaugh (talk | contribs) |
Jfishbaugh (talk | contribs) |
||
| Line 31: | Line 31: | ||
<h3>Progress</h3> | <h3>Progress</h3> | ||
| + | |||
| + | '''Segmentation''' | ||
| + | |||
| + | The 6 pairs of sub-cortical structures (amygdala, caudate, hippocampus, globus pallidus, putamen, lateral ventricle) were segmented using a deformable atlas based pipeline used at the University of Utah. The quality of the ventricles was very poor, so they were further improved by an active contour based segmentation tool, itkSNAP. After this stage, we have 12 shapes at 3 time points. | ||
| + | |||
| + | '''Preprocessing''' | ||
| + | |||
| + | In order to prepare the shapes for longitudinal regression, the different time points must first be rigidly aligned. We do not have point correspondences between our shapes, so we use a Gaussian mixture model based tool called gmmreg to rigidly align the shapes. | ||
| + | |||
| + | We initially align the entire shape complex, rather than individual shapes, in order to preserve the spatial relationship between the anatomical structures. However, there was a small amount of translation and rotation remaining after this process that adversely impacts the growth estimation. To further align the shapes, we also register each shape individually across time. | ||
| + | |||
| + | '''Regression''' | ||
| + | |||
| + | Here, we estimate the continuous evolution of all 12 structures as a shape complex. Three snapshots in time are shown in Fig. 1. We also investigate the evolution of shape volume, summarized in Fig 2. It is important to note that we only model the evolution of shape, and volume is simply measured continuously after regression. | ||
| + | |||
| + | '''Remarks''' | ||
| + | |||
</div> | </div> | ||
Revision as of 15:21, 13 January 2012
Home < 2012 Winter Project Week: Continuous 4D shapes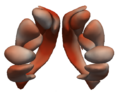
Snapshot of sub-cortical shape evolution. Color denotes magnitude of velocity.


Key Investigators
James Fishbaugh, Hans Johnson, Guido Gerig
Objective
During the 2011 summer project week, we applied our shape regression framework to sub-cortical shapes from a single HD subject. For this project, we plan to begin processing multiple subjects. We would like to compare the trajectories of various measurements of interest, such as volume, across subjects at different stages of disease progression.
Approach, Plan
- Estimate continuous trajectories for sub-cortical structures for multiple subjects
- Investigate volume changes between subjects at different stages of disease progression
- Explore shape evolution for other potentially significant measurements
Progress
Segmentation
The 6 pairs of sub-cortical structures (amygdala, caudate, hippocampus, globus pallidus, putamen, lateral ventricle) were segmented using a deformable atlas based pipeline used at the University of Utah. The quality of the ventricles was very poor, so they were further improved by an active contour based segmentation tool, itkSNAP. After this stage, we have 12 shapes at 3 time points.
Preprocessing
In order to prepare the shapes for longitudinal regression, the different time points must first be rigidly aligned. We do not have point correspondences between our shapes, so we use a Gaussian mixture model based tool called gmmreg to rigidly align the shapes.
We initially align the entire shape complex, rather than individual shapes, in order to preserve the spatial relationship between the anatomical structures. However, there was a small amount of translation and rotation remaining after this process that adversely impacts the growth estimation. To further align the shapes, we also register each shape individually across time.
Regression
Here, we estimate the continuous evolution of all 12 structures as a shape complex. Three snapshots in time are shown in Fig. 1. We also investigate the evolution of shape volume, summarized in Fig 2. It is important to note that we only model the evolution of shape, and volume is simply measured continuously after regression.
Remarks
HD Subjects
10001


10002


10010


10018


10022


10027


Control Subjects
10003


10004


10009


10014


10016


10017


10059


References
- Fishbaugh, J., Durrleman, S., Gerig, G. A Framework for Longitudinal Data Analysis via Shape Regression . SPIE Medical Imaging 2012: Image Processing. Vol. 8314. (To appear)
- Fishbaugh, J., Durrleman, S., Gerig, G. Estimation of Smooth Growth Trajectories with Controlled Acceleration from Time Series Shape Data. Proc. of Medical Image Computing and Computer Assisted Intervention (MICCAI '11). September 2011.