Difference between revisions of "2014 Summer Project Week:Pipeline Visualization"
From NAMIC Wiki
(Added BRAINSTools screenshot) |
|||
| Line 3: | Line 3: | ||
Image:PW-MIT2014.png|[[2014_Summer_Project_Week#Projects|Projects List]] | Image:PW-MIT2014.png|[[2014_Summer_Project_Week#Projects|Projects List]] | ||
Image:Pipeline_visualization_sketch.png| Visualization of pipeline from code | Image:Pipeline_visualization_sketch.png| Visualization of pipeline from code | ||
| + | Image:atlas_pipeline.png|BRAINSTools Template pipeline | ||
</gallery> | </gallery> | ||
Revision as of 13:26, 27 June 2014
Home < 2014 Summer Project Week:Pipeline Visualization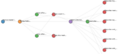
Visualization of pipeline from code
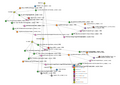
BRAINSTools Template pipeline


Key Investigators
- Ramesh Sridharan, Adrian Dalca, Polina Golland, MIT
Project Description
We have developed an extension to nipype (http://nipy.sourceforge.net/nipype/) that allows for visualization of pipelines and their results. At the project week, we plan to improve the visualization and features and release our code.
Live demo (temporary link): http://shoutkey.com/grant
Objective
We plan to show our demo and get feedback to improve the visualization. Additionally, if time permits, we want to start work on combining this with our lightweight interface to nipype for prototyping pipelines.
Approach, Plan
- Release code / integrate with nipype codebase
- Discuss wishlist for visualization (come see me if you have any thoughts!)