Difference between revisions of "2014 Summer Project Week:Pipeline Visualization"
From NAMIC Wiki
(Added BRAINSTools screenshot) |
|||
| Line 19: | Line 19: | ||
<div style="width: 27%; float: left; padding-right: 3%;"> | <div style="width: 27%; float: left; padding-right: 3%;"> | ||
<h3>Objective</h3> | <h3>Objective</h3> | ||
| − | We plan to show our demo and get feedback to improve the visualization | + | We plan to show our demo and get feedback to improve the visualization. |
</div> | </div> | ||
<div style="width: 27%; float: left; padding-right: 3%;"> | <div style="width: 27%; float: left; padding-right: 3%;"> | ||
| Line 28: | Line 28: | ||
<div style="width: 27%; float: left; padding-right: 3%;"> | <div style="width: 27%; float: left; padding-right: 3%;"> | ||
<h3>Progress</h3> | <h3>Progress</h3> | ||
| + | * Code on github: https://github.com/rameshvs/nipype/tree/visualization-serverhttps://github.com/rameshvs/nipype/tree/visualization-server | ||
| + | * Worked with Dave to visualize Iowa BRAINS pipeline (see screenshot) | ||
</div> | </div> | ||
</div> | </div> | ||
Latest revision as of 13:53, 27 June 2014
Home < 2014 Summer Project Week:Pipeline Visualization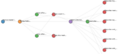
Visualization of pipeline from code
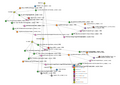
BRAINSTools Template pipeline


Key Investigators
- Ramesh Sridharan, Adrian Dalca, Polina Golland, MIT
Project Description
We have developed an extension to nipype (http://nipy.sourceforge.net/nipype/) that allows for visualization of pipelines and their results. At the project week, we plan to improve the visualization and features and release our code.
Live demo (temporary link): http://shoutkey.com/grant
Objective
We plan to show our demo and get feedback to improve the visualization.
Approach, Plan
- Release code / integrate with nipype codebase
- Discuss wishlist for visualization (come see me if you have any thoughts!)
Progress
- Code on github: https://github.com/rameshvs/nipype/tree/visualization-serverhttps://github.com/rameshvs/nipype/tree/visualization-server
- Worked with Dave to visualize Iowa BRAINS pipeline (see screenshot)