Difference between revisions of "AHM2013-Performance Evaluation Tools"
| Line 10: | Line 10: | ||
Users often (rightly) request performance improvements to improve usability. Developers often have ideas about code that they suspect is consuming the time, and begin to code. But sometimes performance bottlenecks are in unexpected places that can only be quantified with detailed performance assessment tools. These tools can also help measure the impact of code changes. | Users often (rightly) request performance improvements to improve usability. Developers often have ideas about code that they suspect is consuming the time, and begin to code. But sometimes performance bottlenecks are in unexpected places that can only be quantified with detailed performance assessment tools. These tools can also help measure the impact of code changes. | ||
| − | From a user perspective | + | From a user perspective time critical steps include: |
| + | * starting the application (from double-click to ready to use) | ||
| + | * loading data (from clicking OK to data appears) | ||
| + | * saving data (from clicking save to ready for next operation) | ||
| + | * rendering | ||
| + | ** interactive drag-rotate time | ||
| + | ** time from mouse click to new view (e.g. change in visibility) | ||
==Topics== | ==Topics== | ||
Revision as of 17:44, 3 January 2013
Home < AHM2013-Performance Evaluation ToolsBack to AHM main page
Panel
- Jim
- Steve
- Hans
- JC
Background
Users often (rightly) request performance improvements to improve usability. Developers often have ideas about code that they suspect is consuming the time, and begin to code. But sometimes performance bottlenecks are in unexpected places that can only be quantified with detailed performance assessment tools. These tools can also help measure the impact of code changes.
From a user perspective time critical steps include:
- starting the application (from double-click to ready to use)
- loading data (from clicking OK to data appears)
- saving data (from clicking save to ready for next operation)
- rendering
- interactive drag-rotate time
- time from mouse click to new view (e.g. change in visibility)
Topics
- Performance assessment tools: survey of methods and tools across platforms
- Demo of the Instruments package on Mac to evaluate time usage in slicer4
- Review of time-critical points in slicer (as time permits)
- application startup
- loading data
- changes to hierarchy visibility
- DICOM loading
- Discussion of User Priorities for Performance Optimization
Instruments on the Mac
Example Run to test slicer startup time

Pick the Time Profiler to sample the CPU and call stack
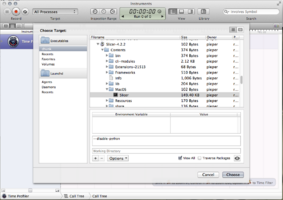
With the Choose Target... option you can pick either an existing running application, or you can specify a program to run when you start profiling. You can also specify command line options and environment variables.

Instruments will give you a browsable timeline showing where the time was spent.


