Difference between revisions of "Linear Mixed-effects shape model to explore Huntington's Disease Data"
From NAMIC Wiki
| Line 2: | Line 2: | ||
<gallery> | <gallery> | ||
Image:PW-MIT2013.png|[[2013_Summer_Project_Week#Projects|Projects List]] | Image:PW-MIT2013.png|[[2013_Summer_Project_Week#Projects|Projects List]] | ||
| − | Image: | + | Image:Ctrl01.png|fixed-effects slope for 7 control subjects (10 sub-cortical structures, 3 time points each). blue => expansion, yellow => contraction] |
| − | Image: | + | Image:HD01.png|fixed-effects slope for 6 HD subjects (10 sub-cortical structures, 3 time points each). blue => expansion, yellow => contraction] |
</gallery> | </gallery> | ||
Revision as of 14:04, 20 June 2013
Home < Linear Mixed-effects shape model to explore Huntington's Disease Data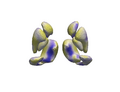
fixed-effects slope for 7 control subjects (10 sub-cortical structures, 3 time points each). blue => expansion, yellow => contraction]
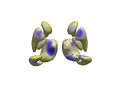
fixed-effects slope for 6 HD subjects (10 sub-cortical structures, 3 time points each). blue => expansion, yellow => contraction]


Key Investigators
- UIowa: Hans Johnson, Dave Welch
- Utah: Manasi Datar, Josh Cates, Ross Whitaker
Objective
Make the linear mixed-effects shape model accessible for further exploration of Huntington's Disease Data
Approach, Plan
Meet with UIowa team to:
- give an overview of results from the linear mixed-effects shape model
- explain the ShapeWorks command line tools to optimze and analyze correspondences
- discuss next steps toward making these tools accessible to UIowa team, to facilitate further exploration of the Huntington's disease Data
Progress
- preliminary results look promising
- ITKv4 module for mixed-effects model (Josh) available for Manasi to test
- ITKv4 module tested on Linux system
- Mixed-effects model for shapes from a single structure from the HD data (in progress)
- Once tested, this module can be used by UIowa team on a larger cohort of cases
References
M Datar, P Muralidharan, A Kumar, S Gouttard, J Piven, G Gerig, RT Whitaker, PT Fletcher, Mixed-Effects Shape Models for Estimating Longitudinal Changes in Anatomy, STIA 2012