Difference between revisions of "Projects:AFibLongitudinalAnalysis"
(Created page with 'Back to Boston University Algorithms __NOTOC__ = Description = To segment the scaring tissue from DE-MRI images, we proposed an effective method that utilizes …') |
|||
| (7 intermediate revisions by the same user not shown) | |||
| Line 1: | Line 1: | ||
| − | Back to [[Algorithm: | + | Back to [[Algorithm:Stony Brook|Stony Brook University Algorithms]] |
__NOTOC__ | __NOTOC__ | ||
= Description = | = Description = | ||
| − | + | The shape evolution of the left atrium in the atrial fibrillation patiens is studied longitudinally to reveal the difference between recover group (CG) and the AFib recurrence group (RG). | |
| − | |||
| − | |||
| − | + | = Method = | |
| − | + | Four sets of shapes are input to the algorithm. The first set contains the shapes of the CG group taken at time 0. The second set contains the shapes of the same group taken at time 1. The third sets are the shapes of the RG group at time 0 and the fourth sets are the RG group at time 1. | |
| + | |||
| + | Subsequently, the shapes evolution profiles between two time points, for both groups, are constructed. This enables a continuous evolution path for both shape groups. | ||
| + | |||
| + | The evolution paths are then traced and statistical tests are performed to evaluate the p-value maps indicating the differences between the two groups. | ||
= Results = | = Results = | ||
| − | + | [[File:LongitudinalAFib.png|800px]] | |
| − | + | ||
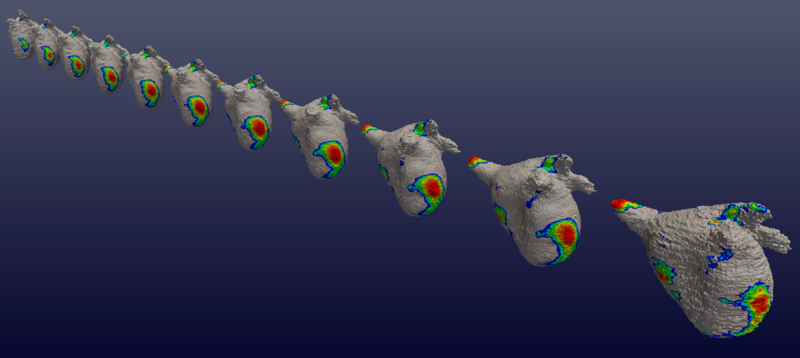
| + | Shape difference. From left to right: mean shapes with p-value map at time 0, 0.1, ..., 1.0. | ||
| − | + | From the evolution of the p-value maps from time 0 to time 1, we can observe the longitudinal shape differences between the cured group and the AFib recurrent group. | |
| − | From | ||
= Key Investigators = | = Key Investigators = | ||
| − | |||
*BWH: Yi Gao and Sylvain Bouix | *BWH: Yi Gao and Sylvain Bouix | ||
| + | *Georgia Tech: Liangjia Zhu | ||
*Boston University: Allen Tannenbaum | *Boston University: Allen Tannenbaum | ||
= Publications = | = Publications = | ||
| − | |||
Latest revision as of 01:04, 16 November 2013
Home < Projects:AFibLongitudinalAnalysisBack to Stony Brook University Algorithms
Description
The shape evolution of the left atrium in the atrial fibrillation patiens is studied longitudinally to reveal the difference between recover group (CG) and the AFib recurrence group (RG).
Method
Four sets of shapes are input to the algorithm. The first set contains the shapes of the CG group taken at time 0. The second set contains the shapes of the same group taken at time 1. The third sets are the shapes of the RG group at time 0 and the fourth sets are the RG group at time 1.
Subsequently, the shapes evolution profiles between two time points, for both groups, are constructed. This enables a continuous evolution path for both shape groups.
The evolution paths are then traced and statistical tests are performed to evaluate the p-value maps indicating the differences between the two groups.
Results
Shape difference. From left to right: mean shapes with p-value map at time 0, 0.1, ..., 1.0.
From the evolution of the p-value maps from time 0 to time 1, we can observe the longitudinal shape differences between the cured group and the AFib recurrent group.
Key Investigators
- BWH: Yi Gao and Sylvain Bouix
- Georgia Tech: Liangjia Zhu
- Boston University: Allen Tannenbaum
