Difference between revisions of "Projects:Utah2ShapeRegression"
Jfishbaugh (talk | contribs) |
Jfishbaugh (talk | contribs) |
||
| Line 33: | Line 33: | ||
[[File:Leave_several_out_summary.png|600px|center|thumb|'''Left:''' Snapshots from a continuous shape evolution of lateral ventricles estimated by our regression model. Acceleration vectors are displayed on the surface, with color denoting magnitude. '''Right:''' The impact of the number of target shapes on R^2.]] | [[File:Leave_several_out_summary.png|600px|center|thumb|'''Left:''' Snapshots from a continuous shape evolution of lateral ventricles estimated by our regression model. Acceleration vectors are displayed on the surface, with color denoting magnitude. '''Right:''' The impact of the number of target shapes on R^2.]] | ||
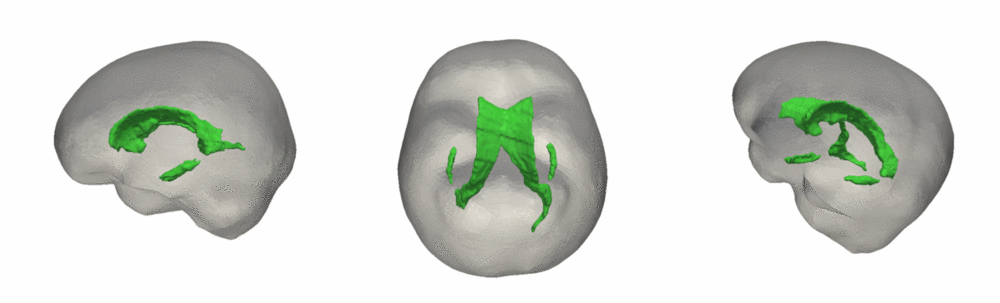
| − | [[File: | + | [[File:Hrp_hrm_lrm_mean_scenario_small_first_frame.png|800px|center|thumb|Mean growth scenarios for HR+ (high risk diagnosed with Autism or ASD), HR- (high risk not diagnosed with Autism), and LR- (controls not diagnosed with Autism).]] |
Revision as of 00:28, 29 September 2011
Home < Projects:Utah2ShapeRegressionBack to Utah 2 Algorithms
Ongoing Work
Updated 9/28/11
Smooth Growth Trajectories from Time Series Shape Data
Segmentation of multi-time point image data of individual subjects results in serial shape data of structures of interest. Clinical research is interested in the spatiotemporal analysis of shape changes, which potentially leads to improved understanding of the rate of change, locality and growth trajectory of structures of interest.
Description
Longitudinal shape analysis often relies on the estimation of a realistic continuous growth scenario from data sparsely distributed in time. In this project, we develop a new type of growth model parameterized by acceleration, whereas standard methods usually control the velocity [1,2]. From this parameterization, we gain one order of differentiability and guarantee that shape evolution is smooth in both space and time. This mimics the behavior of biological tissue as a mechanical system driven by external forces. The growth trajectories are estimated as continuous flows of deformations, which are twice differentiable. The shape regression is based on a correspondence-free technique using currents [2,3], which calculates diffeomorphic flows between set of shapes represented as surface data.

Results
To evaluate our method, we use longitudinal image data from a child that has been scanned 16 times between four and eight years of age. The MRI data is first rigidly aligned to establish a common reference frame. The intracranial volume and lateral ventricles are segmented from each image using an EM based tissue classification algorithm and a level-set based active contour segmentation tool.
We estimate the evolution of the intracranial surface using a regression model based on the piecewise geodesic flow of diffeomorphisms as in [3]. The standard deviation of the Gaussian kernel controlling deformation is set to 50mm, roughly 30% of the diameter of the baseline intracranial surface. For the scale of currents we use 20mm, with a regularity weight of 0.1. Finally, time is discretized in increments of$0.0425 years. We also produce a growth trajectory using our proposed method with the same parameter settings as above except we weight regularity by 0.01 (the two weighted terms cannot be compared since they have different `physical' dimension). The parameters were tuned empirically to produce regressions of comparable quality with both methods.
Shape evolution is considerably smoother using our proposed regression model as compared to the piecewise geodesic model. This is particularly evident in the trajectories of the shape points across time, a subset of which are shown below. It is an important distinction that the trajectories estimated by our method are not a smoothing of the piecewise geodesic method. Rather, the trajectories are the result of fundamentally different assumptions on the underlying model which results in a more realistic estimation of growth.


Former Work
In pilot tests on an infant growth study, we demonstrate that volume measurements taken out of our 3D shape regression are compatible with a 1D regression of these measurements. This implies that also other morphometric measurements of interest for clinicians might be smooth and thus model biological change in a realistic way. Leave-several-out experiments demonstrate that the new method better interpolates between data and is therefore more robust to missing observations. This suggests a greater ability to capture the underlying growth of the anatomical structures.
We plan to apply this method to anatomical shapes of image data on Huntington diseases (HD) provided the IOWA DBP partner. Preliminary studies showed an inflection of change rapid decrease of striatal volume trajectory, and application of this methodology to three time point data might reveal morphological characteristics of such volume loss.
Results
Tests of the prototype shape regression software on synthetic and real image data shows smooth shape evolution based on only few discrete time points. This property will be important when comparing shape change trajectories between different subjects, in particular if images/shapes are not taken at the same time. The regression is based on a correspondence-free method that uses the "currents" method for estimation of diffeomorphic registration. This property might be important when shapes with slightly different topology due to segmentation noise and biological change (see e.g. ventricles) are compared.
The following images show the example of brain ventricles and intracranial volumes (ICV) measured at 6 month, 1year and 2 years of age and the resulting smooth shape evolution.


Literature
[1] Miller, M, I., Trouve, A., Younes, L.: On the metrics and Euler-Lagrange equations of Computational Anatomy. Annual Review of Biomedical Engineering 4 (2002), 375–405
[2] Vaillant, M., Glaunes, J.: Surface matching via currents. In: Proceedings of IPMI. (2005) 381–392
[3] Durrleman, S., Pennec, X., Trouve, A., Gerig, G., Ayache, N.: Spatiotemporal atlas estimation for developmental delay detection in longitudinal datasets. In: Proc. of MICCAI’09, Part I. (2009) 297–304
Key Investigators
- Utah: James Fishbaugh, Stanley Durrleman, Guido Gerig
- IOWA: Hans Johnson