Difference between revisions of "Projects:fMRIClustering"
| Line 49: | Line 49: | ||
Recently, we have applied this method to the cingulum bundle, as shown in the following images: | Recently, we have applied this method to the cingulum bundle, as shown in the following images: | ||
| − | |||
| − | |||
| − | |||
| − | |||
| − | |||
| − | |||
| − | |||
| − | |||
''Fiber Bundle Segmentation'' | ''Fiber Bundle Segmentation'' | ||
| Line 66: | Line 58: | ||
|valign="top"|[[Image:ResultZoomedOut.png |thumb|250px|Zoomed Out View]] | |valign="top"|[[Image:ResultZoomedOut.png |thumb|250px|Zoomed Out View]] | ||
|valign="top"|[[Image:ZoomedResultWithModel.png |thumb|250px|Zoomed In View]] | |valign="top"|[[Image:ZoomedResultWithModel.png |thumb|250px|Zoomed In View]] | ||
| + | |} | ||
| + | |||
| + | |||
| + | |||
| + | ''Experimental Result'' | ||
| + | |||
| + | We used data from 7 subjects with a diverse set of visual experiments including localizer, morphing, rest, internal tasks, and movie. The functional scans were pre-processed for motion artifacts, manually aligned into the Talairach coordinate system, detrended (removing linear trends in the | ||
| + | baseline activation) and smoothed (8mm kernel). | ||
| + | |||
| + | |||
| + | {| | ||
| + | |+ '''Fig 1. 2-System Parcellation. Group-wise result.''' | ||
| + | |valign="top"|[[Image:mit_fmri_clustering_parcellation2_xsub.png |thumb|700px|Detailed View of the Cingulum Bundle Anchor Tract]] | ||
|} | |} | ||
{| | {| | ||
| − | |+ '''Fig | + | |+ '''Fig 2. 2-System Parcelation. Results for all 7 subjects.''' |
| − | |valign="top"|[[Image: | + | |valign="top"|[[Image:mit_fmri_clustering_parcellation2_shb1_4.png |400px]] |
| − | |||
| − | |||
|- | |- | ||
| − | |valign="top"|[[Image: | + | |valign="top"|[[Image:mit_fmri_clustering_parcellation2_shb5_6.png |400px]] |
| − | |||
| − | |||
|- | |- | ||
| − | |valign="top"|[[Image: | + | |valign="top"|[[Image:mit_fmri_clustering_parcellation2_shb7.png |400px]] |
| − | |||
| − | |||
|} | |} | ||
| − | |||
| − | |||
| − | |||
| − | |||
''Project Status'' | ''Project Status'' | ||
Revision as of 21:30, 9 November 2007
Home < Projects:fMRIClusteringBack to NA-MIC_Collaborations, MIT Algorithms
fMRI Clustering
In the classical functional connectivity analysis, networks of interest are defined based on correlation with the mean time course of a user-selected `seed' region. Further, the user has to also specify a subject-specific threshold at which correlation values are deemed significant. In this project, we simultaneously estimate the optimal representative time courses that summarize the fMRI data well and the partition of the volume into a set of disjoint regions that are best explained by these representative time courses. This approach to functional connectivity analysis offers two advantages. First, is removes the sensitivity of the analysis to the details of the seed selection. Second, it substantially simplifies group analysis by eliminating the need for the subject-specific threshold. Our experimental results indicate that the functional segmentation provides a robust, anatomically meaningful and consistent model for functional connectivity in fMRI.
Currently, we are investigating the application of such clustering algorithms in detection of functional connectivity in high-level
Description
Generative Model for Functional Connectivity
We formulate the problem of characterizing connectivity as a partition of voxels into subsets Spatial Activation Patterns in fMRI that are well characterized by Ns representative hypotheses, or time courses, m1; : : : mNs based on the similarity of their time courses to each hypothesis. We model the fMRI signal Y at each voxel as generated by the mixture pY(y) = PNs s=1 �spYjS(yjs) over Ns conditional likelihoods pYjS(yjs) [15]. �s is the prior probability that a voxel belongs to system s 2 f1; : : : ;Nsg. Following a commonly used approach in fMRI analysis, we model the class-conditional densities as normal distributions centered around the system mean time course, i.e., pYjS(yjs) = N(y;ms;�s). The high dimensionality of the fMRI data makes modeling a full covariance matrix impractical. Instead, most methods either limit the modeling to estimating variance elements, or model the time course dynamics as an auto-regressive (AR) process. At this stage, we take the simpler approach of modeling variance and note that the mixture model estimation can be straightforwardly extended to include an AR model. Unlike separate dimensionality reduction procedures, this approach follows closely the notions of functional similarity used by the detection methods in fMRI. In other words, we keep the notion of co-activation consistent with the standard analysis and instead rede�ne how the co-activation patterns are represented and extracted from images. This unsupervised technique generalizes connectivity analysis to situations where candidate seeds are difficult to identify reliably or are unknown.
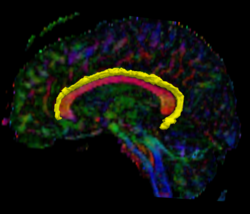
Recently, we have applied this method to the cingulum bundle, as shown in the following images:
Fiber Bundle Segmentation
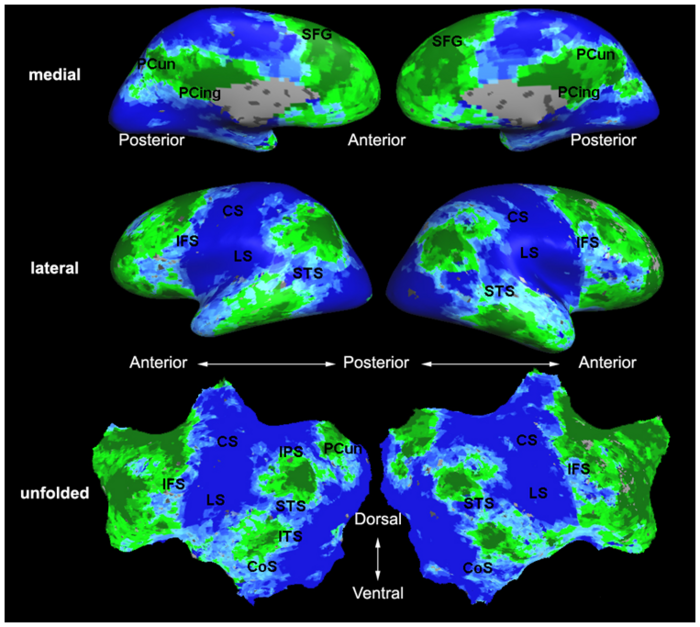
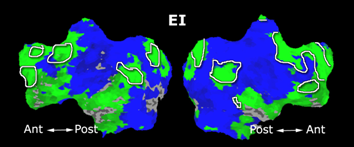
Experimental Result
We used data from 7 subjects with a diverse set of visual experiments including localizer, morphing, rest, internal tasks, and movie. The functional scans were pre-processed for motion artifacts, manually aligned into the Talairach coordinate system, detrended (removing linear trends in the baseline activation) and smoothed (8mm kernel).
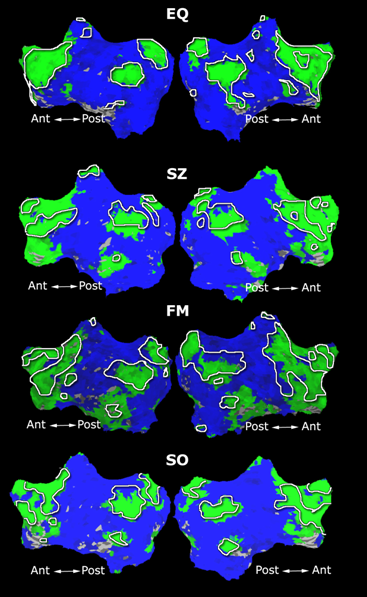
|
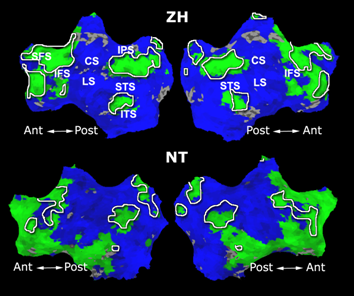
|
|
Project Status
- Working 3D implementation in Matlab using the C-based Mex functions.
- Currently porting to ITK. (last updated 18/Apr/2007)
Key Investigators
- MIT: Danial Lashkari, Polina Golland, Nancy Kanwisher
Publications
In print
- P. Golland, Y. Golland, R. Malach. Detection of Spatial Activation Patterns As Unsupervised Segmentation of fMRI Data. In Proceedings of MICCAI: International Conference on Medical Image Computing and Computer Assisted Intervention, 110-118, 2007.
In press
- D. Lashkari, P. Golland. Convex Clustering with Exemplar-Based Models. In NIPS: Advances in Neural Information Processing Systems, 2007.
