Difference between revisions of "RobustStatisticsSegmentation"
| (25 intermediate revisions by 3 users not shown) | |||
| Line 2: | Line 2: | ||
= Robust Statistics Based Segmentation = | = Robust Statistics Based Segmentation = | ||
| − | == Description == | + | |
| + | {| | ||
| + | |[[Image:RssPanel.png|thumb|280px|RSS module panel]] | ||
| + | |[[Image:RssVentricle.png|thumb|400px|RSS result for Brain MR image]] | ||
| + | |} | ||
| + | |||
| + | == General Information == | ||
| + | === Description === | ||
Given a few initial seeds, we use the robust statistics to construct a feature image out of the original image, and the image segmentation is carried out in the feature image. To do so, we first compute the certain robust statistics, such as the median absolute deviation(MAD) and the interquartile range (IQ), from the seed points. Further, a multi-dimentional probability distribution function is computed from the feature seeds. At each point in the image, the active contour is driven by the probabilities of this pixel belonging to each category indicated by the seeds. | Given a few initial seeds, we use the robust statistics to construct a feature image out of the original image, and the image segmentation is carried out in the feature image. To do so, we first compute the certain robust statistics, such as the median absolute deviation(MAD) and the interquartile range (IQ), from the seed points. Further, a multi-dimentional probability distribution function is computed from the feature seeds. At each point in the image, the active contour is driven by the probabilities of this pixel belonging to each category indicated by the seeds. | ||
| − | == | + | ===Module Type & Category=== |
| + | |||
| + | CLI module in 3D Slicer, in the category of Segmentation | ||
| − | + | ===Authors, Collaborators & Contact=== | |
| − | + | * Yi Gao (Author): Georgia Tech | |
| − | + | * Allen Tannenbaum (Author): Georgia Tech | |
| − | + | * Ron Kikinis (Author): BWH | |
| − | + | * Contact: Yi Gao, yi.gao@gatech.edu | |
| − | |||
== Usage == | == Usage == | ||
| − | |||
[[Image:RobustStatisticsSegmentation_usage1.png | Module parameters | 300px]] ---> | [[Image:RobustStatisticsSegmentation_usage1.png | Module parameters | 300px]] ---> | ||
[[Image:RobustStatisticsSegmentation_usage2.png | Adv Module parameters | 300px]] ---> | [[Image:RobustStatisticsSegmentation_usage2.png | Adv Module parameters | 300px]] ---> | ||
[[Image:RobustStatisticsSegmentation_usage3.png | Adv Module parameters | 300px]] | [[Image:RobustStatisticsSegmentation_usage3.png | Adv Module parameters | 300px]] | ||
| − | === | + | ===Use Cases, Examples=== |
| + | |||
| + | * This module is a general purpose segmenter. | ||
| + | * Link to examples of the module's use | ||
| + | |||
| + | <gallery widths="400px" heights="300px" perrow="2"> | ||
| + | Image:RSSkidneyL.png|Left kidney, CT image(512*512*204). IO time: 10sec, module running time: 12sec (Intel 3.0GHz), <br>Approximate volume: 200 ml, <br>Intensity homogeneity: 0.1, <br>Boundary smoothness: 0.5 | ||
| + | Image:RSS_rkidney.png|Right kidney, CT image(512*512*204). IO time: 10sec, module running time: 15sec (Intel 3.0GHz), <br>Approximate volume: 200 ml, <br>Intensity homogeneity: 0.1, <br>Boundary smoothness: 0.5 | ||
| + | Image:RSS_tumor.png|Brain tumor, MR image(256*256*123). IO time: 3sec, Module running time: 2.5sec (Intel 3.0GHz), <br>Approximate volume: 50 ml, <br>Intensity homogeneity: 0.1, <br>Boundary smoothness: 0.2 | ||
| + | Image:RssVentricle.png|Ventricle, MR image(256*256*124). IO time: 3sec, Module running time: 2.5sec (Intel 3.0GHz), <br>Approximate volume: 30 ml, <br>Intensity homogeneity: 0.02, <br>Boundary smoothness: 0.0 | ||
| + | Image:RSS-aorta.png|Aorta, CT image(512*512*204). IO time: 10sec, module running time: 12sec (Intel 3.0GHz), <br>Approximate volume: 60 ml, <br>Intensity homogeneity: 1.0, <br>Boundary smoothness: 0.0 | ||
| + | Image:RSSMandible.png|Head, CT image(512*512*460) from http://pubimage.hcuge.ch:8080/ MANIX data set. IO time: 16sec, module running time: 160sec (Intel 3.0GHz), <br>Approximate volume: 100 ml, <br>Intensity homogeneity: 0.5, <br>Boundary smoothness: 0.0 | ||
| + | </gallery> | ||
| + | |||
| + | ===Tutorials=== | ||
| + | |||
* First run: | * First run: | ||
| − | # Give a rough estimate of the object volume and | + | # Give a rough estimate of the object volume and use the editing module to paint several non-zero labels, called seeds in the following, in the object. |
# Run the module using the default parameters. | # Run the module using the default parameters. | ||
* Note: | * Note: | ||
# The Approximate volume is just a rough upper limit for the volume. It should be at least the size of the object. This is because when the volume reaches that, the program must stop. However, other criteria may stop the algorithm before the volume reaches this value. | # The Approximate volume is just a rough upper limit for the volume. It should be at least the size of the object. This is because when the volume reaches that, the program must stop. However, other criteria may stop the algorithm before the volume reaches this value. | ||
| − | # The | + | # The positions of the seeds have to be in the object, preferably close to center. |
* Troubleshooting | * Troubleshooting | ||
| Line 43: | Line 65: | ||
** '''Some regions are missed, at the same time leakages to some other regions'''. Try (either one) | ** '''Some regions are missed, at the same time leakages to some other regions'''. Try (either one) | ||
*** Increase "Intensity homogeneity" | *** Increase "Intensity homogeneity" | ||
| − | *** Add | + | *** Add some other seeds |
| − | |||
| − | + | * Data Set http://www.spl.harvard.edu/publications/item/view/1180 Tumorbase.zip at page bottom, in the zip file, case3/grayscale.nrrd | |
| − | + | 1. Draw label map in Editing module | |
| − | + | In the editing module, select any drawing tool, for example the "Paint" tool circled in red. Draw some strokes in the target in one of the 2D views. In this example, we only freely draw the "S" shaped label circled in green. The label image is available at: [[File:RSS_Grayscale-label.nrrd|Label image]] | |
| − | |||
| − | + | [[Image:RSS_editStep.png | Drawing label map for RSS| 700px]] | |
| + | 2. Run RSS. | ||
| + | To run the RSS module. The parameters which may affect the segmentation results include: ''Approximate volume'', ''Intensity homogeneity'', ''Boundary smoothness'', ''Max running time''. The particular setting of the parameters for this example case is shown in the screenshot, in the red box. Some guidelines for adjusting them are given in the '''Troubleshooting''' section above, whereas their general roles in influencing the results are given in the '''Quick Tour of Features and Use''' section below. The sensitivity of the parameters are not quantitatively evaluated. In some easy cases, the algorithm is rather robust to the parameters. However for some objects with inhomogeneous intensity as well as irregular shape, the parameters may need to be carefully tuned. | ||
| − | + | [[Image:RSS_run.png | Set up RSS module| 700px]] | |
| − | + | * Multiple-value label map handling | |
| − | + | The parameter "Output Label Value"(OLV) is for user to assign the output label value. Moreover, when user provided label map contains several labels, the target corresponding to the OLV is the one get segmented. More specifically, there are three difference situations: | |
| − | |||
| − | |||
| − | |||
| − | + | # user provided label map contains only one label value, L. In this case, the output label value will be set to OLV, not matter what value L takes. | |
| + | # user provided label map contains multiple label values, one of which matches OLV. Then only that label will be effective and all the others are discarded. The output will have label value OLV too. | ||
| + | # user provided label map contains multiple label values, but none matches OLV. Then all the non-zero labels will be considered as a single label value and then come back to the case 1 above. | ||
| + | In the current version, regardless of the number of different labels appearing in the label map, only one object is extracted from the image. The on-going work extends this to extracting multiple objects simultaneously. | ||
| − | == | + | ===Quick Tour of Features and Use=== |
| − | + | A list panels in the interface, their features, what they mean, and how to use them. For instance: | |
| − | |||
| − | |||
| − | |||
| − | + | {||| | |
| + | * '''Parameters panel:''' | ||
| + | ** '''Approximate volume:''' The estimated upper limit of the target volume. The resulting volume will be less or equal than this value. | ||
| + | ** '''Intensity homogeneity:''' If the target contains homogeneous intensity, then give a close-to-1 value here. | ||
| + | ** '''Boundary smoothness:''' Larger value will result in smoother boundary and a more spherical looking result. | ||
| + | ** '''Output Label Value:''' Defined the label value of the output. Also refer to the "Multiple-value label map handling" above. | ||
| + | ** '''Max running time:''' The upper limit for program running time. | ||
| + | * '''IO panel:''' | ||
| + | ** '''Input Image:''' The image to be segmented. | ||
| + | ** '''Label Image:''' The label map providing initial seeds. | ||
| + | * '''Output Volume:''' The output volumetric image. | ||
| + | |[[Image:RssPanel.png|thumb|280px|User Interface]] | ||
| + | |} | ||
| − | + | == Development == | |
| + | ===Source code & documentation=== | ||
| − | + | The source code of the algorithm is in 3D Slicer source directory tree. Under Slicer3/Applications/CLI/RobustStatisticsSegmenter/ | |
| − | + | Moreover, the code above is a self-contained implementation for the 3D Sparse Filed Level Set method. The level set evolution is implemented in the base class. Specific flow, such as Chan-Vese, Geodesic Active Contour, or the Robust Statistics based flow, can be implemented in the derived class. Therefore, it can be reused for other types of flow with not much work. | |
| − | + | ||
| − | |||
| − | |||
| − | + | = Multi-Object RSS (MORSS)= | |
| + | {| | ||
| + | |[[Image:RSS_MultiObjSeg1.png|thumb|400px|RSS result for abdominal CT image]] | ||
| + | |} | ||
| − | |||
| + | == Description == | ||
| − | + | In contrast to the above single object RSS, in MORSS, the user can use different label (color) to draw the seed label image. After that, the algorithm detect the number of objects and evolve multiple contours simultaneously. | |
| − | + | ==Module Type & Category== | |
| − | |||
| − | |||
| − | |||
| − | |||
| − | + | CLI module in 3D Slicer Extension, in the category of Segmentation. Need to install from Extension Manager. | |
| − | |||
| − | |||
| − | |||
| − | |||
| − | |||
| − | |||
| − | |||
| − | |||
| − | |||
| − | |||
| − | |||
| − | |||
| − | |||
| − | |||
| − | |||
| − | |||
| − | |||
| − | |||
| − | |||
| − | |||
| − | |||
| − | |||
| − | |||
| − | |||
| − | |||
| − | |||
| − | |||
| − | |||
| − | |||
| − | |||
| − | |||
| − | |||
| − | |||
| − | |||
| − | |||
| − | |||
| + | == Usage == | ||
| + | The basic steps of MORSS is the same as RSS. In fact, if only one type of seed is given (one non-zero label), the MORSS is in fact the single object RSS above. | ||
| − | + | Moreover, since the number of labels are determined after the algorithm starts, on the user interface, it is difficult to adjust the parameters for each of the target object. Therefore in the current version, the same parameters set on the GUI apply to all the contours. This, however, may not be desirable in all cases. Similar situation is for the expected volume. So on the GUI, we didn't ask for the expected volume. Instead, we used a more engineering term "number of iterations", which also applies to all the contours. | |
| − | |||
| − | |||
| − | |||
| − | + | Looking forward, if the algorithm is implemented as a loadable module, then we can have more flexible control over the GUI. In particular, we can create a several-step-module. In the first step the user provide the input and label image. By clicking "Process label image", the number of different labels are learned from the label image. In addition, the GUI of the second step is adaptively adjusted. | |
| − | [[ | + | ===Use Cases, Examples=== |
| + | ====Meningioma==== | ||
| + | The testing image of this example can be downloaded at: [[File:RSS_Grayscale.nrrd|example image]] | ||
| + | The label image is at: [[File:MORSS_Grayscale-multilabel.nrrd|multiple label seed image]] | ||
| − | == | + | ====Cardix==== |
| + | The testing image of this example is sub-sampled from the CARDIX data set from Orisix data set and can be downloaded at: [[File:RSS_CARDIX-sub2.nrrd|example image]] | ||
| + | The label image is at: [[File:RSS_sub2_cardix_LVlabel.nrrd|left ventricle label seed image]] | ||
| + | Parameters are: Approx vol limit 300mL, IH = 0.01, BS=0.1, Threshold= default(= 2) | ||
| − | + | The multi label image is at: [[File:MORSS_CARDIX-sub2-multilabel.nrrd|multi-label seed image]] | |
| + | Parameters are: IH = 0.5, BS=0.6, number of iteration 600. | ||
| − | + | =Acknowledgment= | |
| + | This work was supported in part by grants from NSF, AFOSR, ARO, as well as by a grant from | ||
| + | NIH (NAC P41 RR-13218) through Brigham and Women’s | ||
| + | Hospital. An NSF Fellowship supported part of the work. | ||
== Publications == | == Publications == | ||
The method is based on: | The method is based on: | ||
| − | * | + | * Yi Gao, Ron Kikinis, Sylvain Bouix, Martha Shenton, Allen Tannenbaum, ''A 3D Interactive Multi-object Segmentation Tool using Local Robust Statistics Driven Active Contours'', Medical Image Analysis, 2012, http://dx.doi.org/10.1016/j.media.2012.06.002 |
| − | |||
==Rons== | ==Rons== | ||
[[File:RobustSeg.zip|example case]] | [[File:RobustSeg.zip|example case]] | ||
Latest revision as of 16:25, 24 October 2012
Home < RobustStatisticsSegmentationRobust Statistics Based Segmentation


General Information
Description
Given a few initial seeds, we use the robust statistics to construct a feature image out of the original image, and the image segmentation is carried out in the feature image. To do so, we first compute the certain robust statistics, such as the median absolute deviation(MAD) and the interquartile range (IQ), from the seed points. Further, a multi-dimentional probability distribution function is computed from the feature seeds. At each point in the image, the active contour is driven by the probabilities of this pixel belonging to each category indicated by the seeds.
Module Type & Category
CLI module in 3D Slicer, in the category of Segmentation
Authors, Collaborators & Contact
- Yi Gao (Author): Georgia Tech
- Allen Tannenbaum (Author): Georgia Tech
- Ron Kikinis (Author): BWH
- Contact: Yi Gao, yi.gao@gatech.edu
Usage
 --->
--->
 --->
--->

Use Cases, Examples
- This module is a general purpose segmenter.
- Link to examples of the module's use
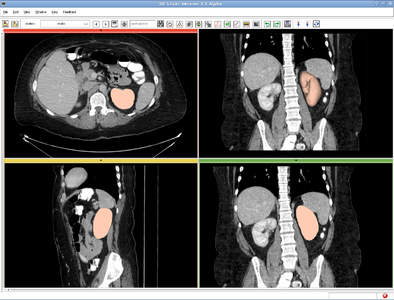
Left kidney, CT image(512*512*204). IO time: 10sec, module running time: 12sec (Intel 3.0GHz),
Approximate volume: 200 ml,
Intensity homogeneity: 0.1,
Boundary smoothness: 0.5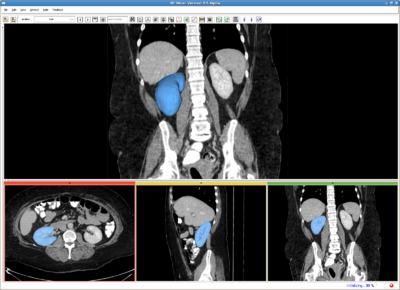
Right kidney, CT image(512*512*204). IO time: 10sec, module running time: 15sec (Intel 3.0GHz),
Approximate volume: 200 ml,
Intensity homogeneity: 0.1,
Boundary smoothness: 0.5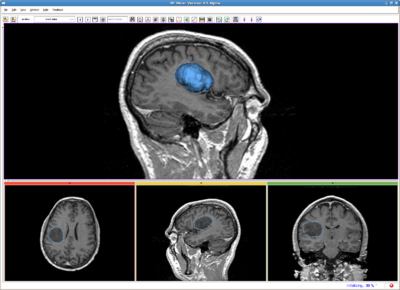
Brain tumor, MR image(256*256*123). IO time: 3sec, Module running time: 2.5sec (Intel 3.0GHz),
Approximate volume: 50 ml,
Intensity homogeneity: 0.1,
Boundary smoothness: 0.2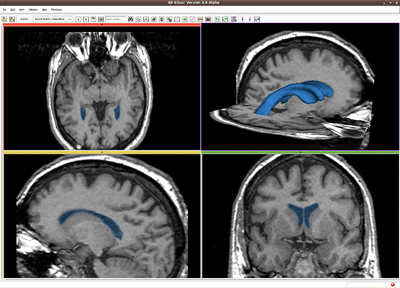
Ventricle, MR image(256*256*124). IO time: 3sec, Module running time: 2.5sec (Intel 3.0GHz),
Approximate volume: 30 ml,
Intensity homogeneity: 0.02,
Boundary smoothness: 0.0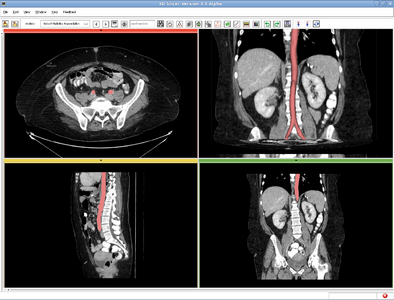
Aorta, CT image(512*512*204). IO time: 10sec, module running time: 12sec (Intel 3.0GHz),
Approximate volume: 60 ml,
Intensity homogeneity: 1.0,
Boundary smoothness: 0.0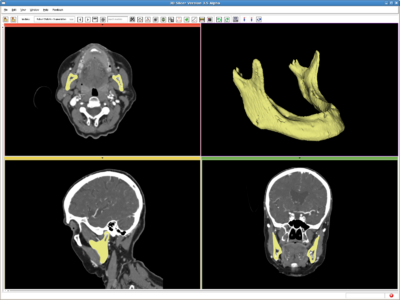
Head, CT image(512*512*460) from http://pubimage.hcuge.ch:8080/ MANIX data set. IO time: 16sec, module running time: 160sec (Intel 3.0GHz),
Approximate volume: 100 ml,
Intensity homogeneity: 0.5,
Boundary smoothness: 0.0


Tutorials
- First run:
- Give a rough estimate of the object volume and use the editing module to paint several non-zero labels, called seeds in the following, in the object.
- Run the module using the default parameters.
- Note:
- The Approximate volume is just a rough upper limit for the volume. It should be at least the size of the object. This is because when the volume reaches that, the program must stop. However, other criteria may stop the algorithm before the volume reaches this value.
- The positions of the seeds have to be in the object, preferably close to center.
- Troubleshooting
- Surface is too rough. Try:
- Increase "Boundary smoothness"
- Leakage into thin/narrow regions. Try:
- Increase "Boundary smoothness"
- leakage into similar (but still different) intensity regions (which is not necessarily thin), Try:
- Increase "Intensity homogeneity"
- Some regions are missed: Try (either one):
- Increase "Max volume"
- Decrease"Intensity homogeneity"
- Decrease "Boundary smoothness"
- Some regions are missed, at the same time leakages to some other regions. Try (either one)
- Increase "Intensity homogeneity"
- Add some other seeds
- Surface is too rough. Try:
- Data Set http://www.spl.harvard.edu/publications/item/view/1180 Tumorbase.zip at page bottom, in the zip file, case3/grayscale.nrrd
1. Draw label map in Editing module
In the editing module, select any drawing tool, for example the "Paint" tool circled in red. Draw some strokes in the target in one of the 2D views. In this example, we only freely draw the "S" shaped label circled in green. The label image is available at: File:RSS Grayscale-label.nrrd

2. Run RSS.
To run the RSS module. The parameters which may affect the segmentation results include: Approximate volume, Intensity homogeneity, Boundary smoothness, Max running time. The particular setting of the parameters for this example case is shown in the screenshot, in the red box. Some guidelines for adjusting them are given in the Troubleshooting section above, whereas their general roles in influencing the results are given in the Quick Tour of Features and Use section below. The sensitivity of the parameters are not quantitatively evaluated. In some easy cases, the algorithm is rather robust to the parameters. However for some objects with inhomogeneous intensity as well as irregular shape, the parameters may need to be carefully tuned.

- Multiple-value label map handling
The parameter "Output Label Value"(OLV) is for user to assign the output label value. Moreover, when user provided label map contains several labels, the target corresponding to the OLV is the one get segmented. More specifically, there are three difference situations:
- user provided label map contains only one label value, L. In this case, the output label value will be set to OLV, not matter what value L takes.
- user provided label map contains multiple label values, one of which matches OLV. Then only that label will be effective and all the others are discarded. The output will have label value OLV too.
- user provided label map contains multiple label values, but none matches OLV. Then all the non-zero labels will be considered as a single label value and then come back to the case 1 above.
In the current version, regardless of the number of different labels appearing in the label map, only one object is extracted from the image. The on-going work extends this to extracting multiple objects simultaneously.
Quick Tour of Features and Use
A list panels in the interface, their features, what they mean, and how to use them. For instance:
- Parameters panel:
- Approximate volume: The estimated upper limit of the target volume. The resulting volume will be less or equal than this value.
- Intensity homogeneity: If the target contains homogeneous intensity, then give a close-to-1 value here.
- Boundary smoothness: Larger value will result in smoother boundary and a more spherical looking result.
- Output Label Value: Defined the label value of the output. Also refer to the "Multiple-value label map handling" above.
- Max running time: The upper limit for program running time.
- IO panel:
- Input Image: The image to be segmented.
- Label Image: The label map providing initial seeds.
- Output Volume: The output volumetric image.
Development
Source code & documentation
The source code of the algorithm is in 3D Slicer source directory tree. Under Slicer3/Applications/CLI/RobustStatisticsSegmenter/
Moreover, the code above is a self-contained implementation for the 3D Sparse Filed Level Set method. The level set evolution is implemented in the base class. Specific flow, such as Chan-Vese, Geodesic Active Contour, or the Robust Statistics based flow, can be implemented in the derived class. Therefore, it can be reused for other types of flow with not much work.
Multi-Object RSS (MORSS)

Description
In contrast to the above single object RSS, in MORSS, the user can use different label (color) to draw the seed label image. After that, the algorithm detect the number of objects and evolve multiple contours simultaneously.
Module Type & Category
CLI module in 3D Slicer Extension, in the category of Segmentation. Need to install from Extension Manager.
Usage
The basic steps of MORSS is the same as RSS. In fact, if only one type of seed is given (one non-zero label), the MORSS is in fact the single object RSS above.
Moreover, since the number of labels are determined after the algorithm starts, on the user interface, it is difficult to adjust the parameters for each of the target object. Therefore in the current version, the same parameters set on the GUI apply to all the contours. This, however, may not be desirable in all cases. Similar situation is for the expected volume. So on the GUI, we didn't ask for the expected volume. Instead, we used a more engineering term "number of iterations", which also applies to all the contours.
Looking forward, if the algorithm is implemented as a loadable module, then we can have more flexible control over the GUI. In particular, we can create a several-step-module. In the first step the user provide the input and label image. By clicking "Process label image", the number of different labels are learned from the label image. In addition, the GUI of the second step is adaptively adjusted.
Use Cases, Examples
Meningioma
The testing image of this example can be downloaded at: File:RSS Grayscale.nrrd The label image is at: File:MORSS Grayscale-multilabel.nrrd
Cardix
The testing image of this example is sub-sampled from the CARDIX data set from Orisix data set and can be downloaded at: File:RSS CARDIX-sub2.nrrd The label image is at: File:RSS sub2 cardix LVlabel.nrrd Parameters are: Approx vol limit 300mL, IH = 0.01, BS=0.1, Threshold= default(= 2)
The multi label image is at: File:MORSS CARDIX-sub2-multilabel.nrrd Parameters are: IH = 0.5, BS=0.6, number of iteration 600.
Acknowledgment
This work was supported in part by grants from NSF, AFOSR, ARO, as well as by a grant from NIH (NAC P41 RR-13218) through Brigham and Women’s Hospital. An NSF Fellowship supported part of the work.
Publications
The method is based on:
- Yi Gao, Ron Kikinis, Sylvain Bouix, Martha Shenton, Allen Tannenbaum, A 3D Interactive Multi-object Segmentation Tool using Local Robust Statistics Driven Active Contours, Medical Image Analysis, 2012, http://dx.doi.org/10.1016/j.media.2012.06.002