VIZBI2010
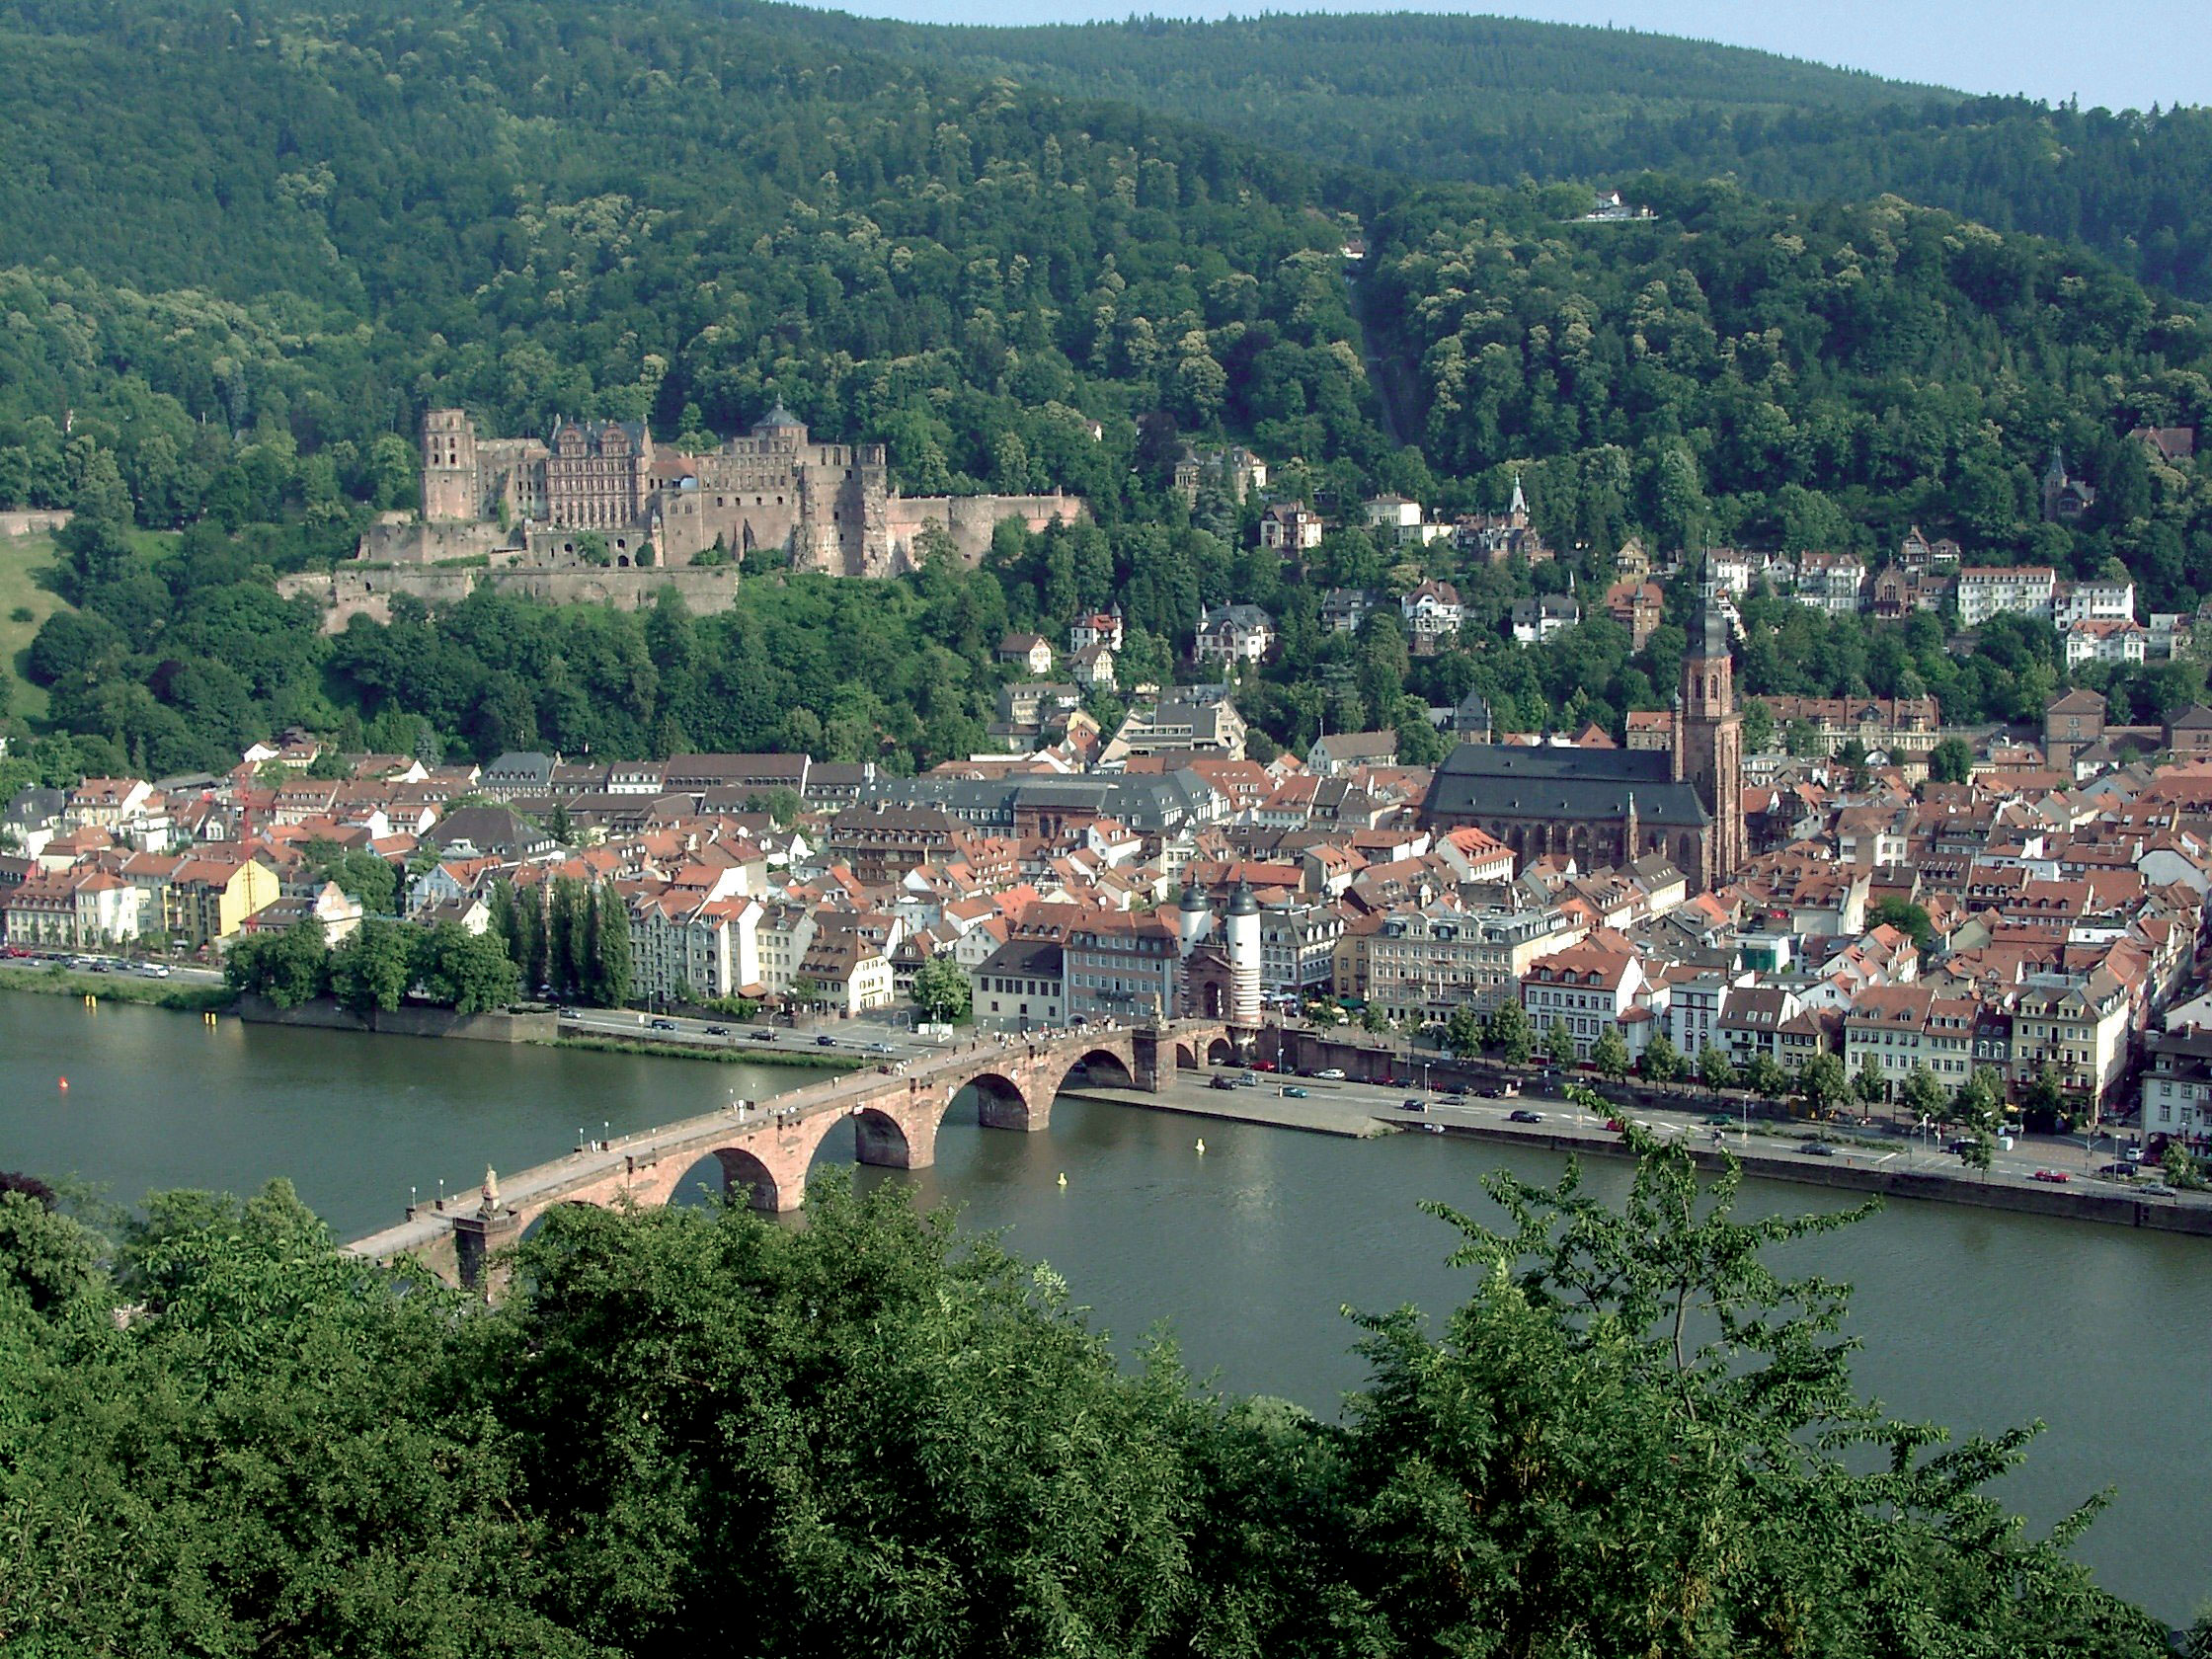
| This wiki page can be used to provide supplemental information, links, and discussion for topics covered in the VIZBI 2010 conference in Heidelberg March 3-5, 2010 at the EMBL. |

Contents
VIZBI Links
Special Issue of Nature Methods
The speakers collaborated on a set of papers summarizing the current state of bioimaging visualization that were published as a special issue of Nature Methods.
Comments on friendfeed
Community notes are available on friendfeed: http://friendfeed.com/vizbi2010
Wednesday
MRI
- Pieper:
- Slides.
- Movies, slide shows, and documentation for the Query Atlas project mentioned during the talk can be found on this page.
- Open source software for MRI processing can be found at the 3D Slicer web site.
- The National Alliance for Medical Image Processing provides resources and opportunities for collaboration on image analysis topics.
Posters 'W'
Optical Microscopy
Keynote
Thursday
Systems Biology
Matt Hibbs Matt gave a beautifully clear into to expression array analysis. He also discussed his own tool HIDRA enables comparison of several heat maps, each from different experiments.
Oliver Kohlbacher From Spectra to Networks - Visualizing Proteomics Data Again, very clear into to proteomics methodology. Shotgun proteomics means fragmenting proteins using enzymes (e.g., trypsin), then separate using mass spectrometry. Tandom-MS the first separation is via mass, then each peak is further broken down using direct collisions (collision-induced dissociation (CID). This enables determination of the sequence.
2M maps are obtains: one dimension is charge/mass ratio, the other is retention time.
Role of visualization in proteomics: quality, manual/low-throughput analysis; validate automatic analyses (this is where the field is heading, more automation).
Primarily visualization is mass spectra themselves > signal process reduces them to 'stick' spectra (reduce data size by an order of magnitude).
2D mass spectra - one of the problems is simply getting them into memory: they are up to 200GB.
Question: is that even with the 'stick' specrta?
A key problem is lack of data standards.
One dimension/data volume reduction is to fit the spectra to a mathematical model, then you can replace the data by the model.
Retention time and mass (the two primary dimensions) do not have a 'biological' meaning.
Can compare two samples (e.g., disease vs healthy tissue), can create expression profiles that are similar to gene expression profiles.
Key challenges: data volume (hence need data reduction); however, experimentalists always need to go back to the raw data/spectra; integration with other omics data and networks; rapidly changing experimental techniques (difficult to keep up).
Key difference to gene expression profiling: visualization methods are the same, but the key difference is that with protein expression we need to go back to the raw data.
Uniqueness of sequence fragments: antibodies recognize proteins uniquesly with just 9 residues: 8 residues is already sufficient to have on average only one match in human.
"We are back to sending hard disks by mail" - same situation as for image data.
Metabolomics Data (Alexander Goesmann) They take genomes of organisms (e.g., bacterial genome), then reassemble pathways using a tool called 'CARMEN'. They visualize in CellDesigner.
They also compare two genomes: first they have metabolic pathways from one organism, then map onto that information about the comparison, typically showing which genes are missing.
"Metabolome is closer to the actual phenotype than other omics data"
Human have perhaps ~2,500 metabolites; compared with ~1 million proteins, 150,000 transcripts.
Nice illustration of the need for different experimental approaches: no one approach can find all metabolites.
Typical workflow: raw spectra > stick spectra > table of compounds > heat+dendrogram > network enhancement
Nice spectra of beer :) Certainly makes the work relevant.
Nice PCA plot showing clear separation of the metabolitic profile between normal and disease patients: this shows the power of the method to find biomarkers.