File:Results Tumor-Model.png
Original file (885 × 230 pixels, file size: 15 KB, MIME type: image/png)
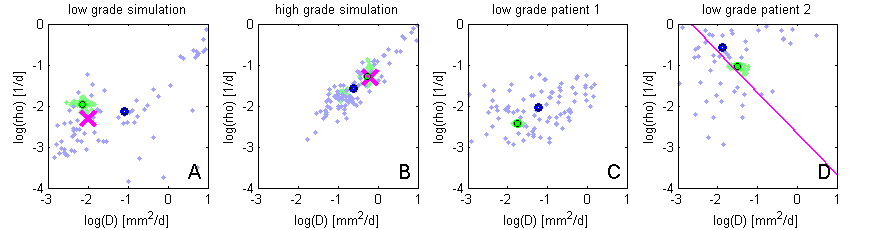
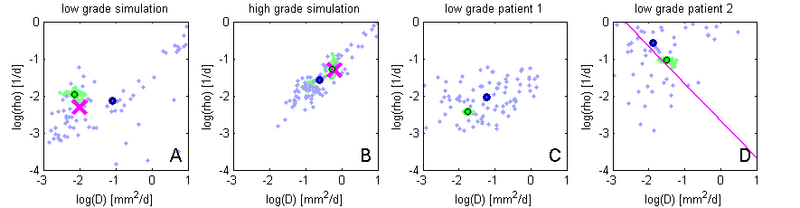
MCMC sampling results in the space spanned by model parameters D and rho, for the four experiments. Green samples are obtained from the sparse grid interpolation Eq. (12), blue-purple samples come from the direct sampling in Eq. (10). Black circles indicate means of the two distributions. Ground truth for A and B are indicated by the pink cross. In D the previously estimated speed of growth [7] is shown by the pink line. The sparse grid sampling approximation performs better than the direct MCMC (A-B). Estimates correlate well with results from [7], but provide a more accurate characterization of the state of disease (D).
File history
Click on a date/time to view the file as it appeared at that time.
| Date/Time | Thumbnail | Dimensions | User | Comment | |
|---|---|---|---|---|---|
| current | 22:47, 24 March 2011 | 885 × 230 (15 KB) | Bmenze (talk | contribs) | MCMC sampling results in the space spanned by model parameters D and rho, for the four experiments. Green samples are obtained from the sparse grid interpolation Eq. (12), blue-purple samples come from the direct sampling in Eq. (10). Black circles indica |
- You cannot overwrite this file.
File usage
The following page uses this file: