File:UNC longitudinalAtlasEx1.png

Original file (821 × 332 pixels, file size: 192 KB, MIME type: image/png)
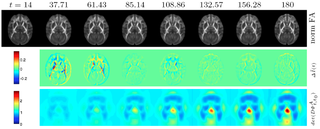
Longitudinal macaque developmental DTI atlas from postnatal day 14 to 180 as visualized on a center axial slice. Top row: Reconstructed atlas image at each age pulled back to day 14. The high quality of the longitudinal modeling is visible through the close similarity of the pulled-back atlas images. Middle row: Estimated change in FA between time points displaying major change occurring in the first 60 days (overshadowing the magnitude of later changes). Bottom row: Jacobian determinant of the pull-back deformation field. Cyan = no change, dark blue = growth (most of white matter), yellow-red = shrinkage (here seen on the 3rd ventricle in the center of the image)
File history
Click on a date/time to view the file as it appeared at that time.
| Date/Time | Thumbnail | Dimensions | User | Comment | |
|---|---|---|---|---|---|
| current | 19:40, 15 April 2011 | 821 × 332 (192 KB) | Styner (talk | contribs) | Longitudinal macaque developmental DTI atlas from postnatal day 14 to 180 as visualized on a center axial slice. Top row: Reconstructed atlas image at each age pulled back to day 14. The high quality of the longitudinal modeling is visible through the clo |
- You cannot overwrite this file.
File usage
The following 3 pages uses this file: