Difference between revisions of "2010 Winter Project Week DTI Fiber Tract Statistics"
(Created page with '__NOTOC__ <gallery> Image:PW-SLC2010.png|Projects List Image:genuFAp.jpg|Kernel regression along the fiber tract, also showing the scatter p…') |
|||
| Line 5: | Line 5: | ||
Image:genuFA.jpg|Sub plots showing FA values distribution in various cross-sections along the fiber tract length. | Image:genuFA.jpg|Sub plots showing FA values distribution in various cross-sections along the fiber tract length. | ||
</gallery> | </gallery> | ||
| − | |||
| − | |||
| − | |||
| − | |||
| − | |||
| − | |||
| − | |||
==Key Investigators== | ==Key Investigators== | ||
Revision as of 19:43, 16 December 2009
Home < 2010 Winter Project Week DTI Fiber Tract Statistics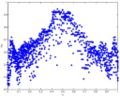
Kernel regression along the fiber tract, also showing the scatter plot for DTI data.
Sub plots showing FA values distribution in various cross-sections along the fiber tract length.


Key Investigators
- Utah: Anuja Sharma, Guido Gerig
Objective
The goal is to understand probabilistic models that can account for the behavior of water diffusion in white matter tracts.
Approach, Plan
The challenge lies in deciphering the underlying probabilistic framework and delineating the relationship between white matter structure and variables like age, gender, physical condition or even high risk for a specific disease. This is done using a command line tool which perform kernel based regression on the DTI data. Casey's functional data analysis pipeline is then applied to this data. The idea is to try out different noise models and statistical measures which are robust to Partial Volume effect and yet give statistically significant results. Our plan for the project week is to try out the complete pipeline for a few datasets and see if this module can be integrated into the Slicer environment.
Progress
The first version of the command line tool is ready. It also incorporates several visualization options which would help in analyzing the best noise models and the best representative statistics to explain the distribution of DTI data along the fiber tract.
References
- Casey B. Goodlett, P. Thomas Fletcher, John H. Gilmore, Guido Gerig. Group Analysis of DTI Fiber Tract Statistics with Application to Neurodevelopment. NeuroImage 45 (1) Supp. 1, 2009. p. S133-S142