Difference between revisions of "2010 Winter Project Week DTI Fiber Tract Statistics"
| Line 23: | Line 23: | ||
<h3>Approach, Plan</h3> | <h3>Approach, Plan</h3> | ||
| − | The challenge lies in deciphering the underlying probabilistic framework and delineating the relationship between white matter structure and variables like age, gender, physical condition or even high risk for a specific disease. | + | The challenge lies in deciphering the underlying probabilistic framework and delineating the relationship between white matter structure and variables like age, gender, physical condition or even high risk for a specific disease. |
| − | Our plan for the project week is to try out the complete pipeline for a few datasets and see if this module | + | |
| + | Various tract-oriented scalar diffusion measures are treated as a continuous function of fiber arc-length. To analyze the trend along the fiber tract, a command line tool performs kernel regression on this data. The idea is to try out different noise models and maximum likelihood estimates within kernel windows, such that they best represent the data and are robust to noise and Partial Volume effect. | ||
| + | |||
| + | Casey Goodlett's functional data analysis pipeline is then applied to this data. Here, multivariate hypothesis test is used to test for differences between populations. | ||
| + | |||
| + | Our plan for the project week is to try out the complete pipeline for a few datasets and see if we get statistically significant results. We also plan to work on the possibility of integrating this module into the Slicer environment. | ||
</div> | </div> | ||
| Line 32: | Line 37: | ||
<h3>Progress</h3> | <h3>Progress</h3> | ||
| − | The first version of the command line tool is ready. It also incorporates several visualization options which | + | The first version of the command line tool is ready. It provides the flexibility to choose the scalar diffusion measure to be tested; a choice between Gaussian and Beta noise models and Mean, median or mode as MLE. It also incorporates several visualization options which help in analyzing the best noise models and the best representative statistics to explain the distribution of DTI data along the fiber tract. |
</div> | </div> | ||
Revision as of 17:25, 4 January 2010
Home < 2010 Winter Project Week DTI Fiber Tract Statistics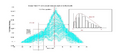
Kernel regression along the fiber tract, also showing the scatter plot for DTI data.
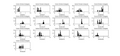
Sub plots showing distribution of FA values in various cross-sections along the fiber tract length.


Key Investigators
- Utah: Anuja Sharma, Guido Gerig
Objective
The goal is to understand probabilistic models that can account for the behavior of water diffusion in white matter tracts.
Approach, Plan
The challenge lies in deciphering the underlying probabilistic framework and delineating the relationship between white matter structure and variables like age, gender, physical condition or even high risk for a specific disease.
Various tract-oriented scalar diffusion measures are treated as a continuous function of fiber arc-length. To analyze the trend along the fiber tract, a command line tool performs kernel regression on this data. The idea is to try out different noise models and maximum likelihood estimates within kernel windows, such that they best represent the data and are robust to noise and Partial Volume effect.
Casey Goodlett's functional data analysis pipeline is then applied to this data. Here, multivariate hypothesis test is used to test for differences between populations.
Our plan for the project week is to try out the complete pipeline for a few datasets and see if we get statistically significant results. We also plan to work on the possibility of integrating this module into the Slicer environment.
Progress
The first version of the command line tool is ready. It provides the flexibility to choose the scalar diffusion measure to be tested; a choice between Gaussian and Beta noise models and Mean, median or mode as MLE. It also incorporates several visualization options which help in analyzing the best noise models and the best representative statistics to explain the distribution of DTI data along the fiber tract.
References
- Casey B. Goodlett, P. Thomas Fletcher, John H. Gilmore, Guido Gerig. Group Analysis of DTI Fiber Tract Statistics with Application to Neurodevelopment. NeuroImage 45 (1) Supp. 1, 2009. p. S133-S142