Difference between revisions of "2010 Winter Project Week Tractography using DTI Atlasing"
(Created page with '__NOTOC__ <gallery> Image:PW-SLC2010.png|Projects List Image:Anuja_scatter1.png|Kernel regression along the fiber tract, also showing the sc…') |
|||
| Line 7: | Line 7: | ||
==Key Investigators== | ==Key Investigators== | ||
| − | * Utah: | + | * Utah: Gopalkrishna Veni, Ross Whitaker, Sarang Joshi |
<div style="margin: 20px;"> | <div style="margin: 20px;"> | ||
| Line 14: | Line 14: | ||
<h3>Objective</h3> | <h3>Objective</h3> | ||
| − | + | To study the effect of drugs on teenagers in the age of 12-30. | |
| Line 25: | Line 25: | ||
| − | + | Initially, the DWI data is preprocessed to address Eddy current correction and EPI distortion correction. Next, DTI Atlas building is performed using Casey’s DTI analysis pipeline* to bring all the DTI images into a common co-ordinate system and then fiber tract analysis is performed to compare the differences in specific fiber tracts. Our aim for the project week is to explore various DTI analysis tools developed by NAMIC to perform tractography. | |
| − | |||
| − | |||
| − | |||
| − | Our | ||
</div> | </div> | ||
| Line 37: | Line 33: | ||
<h3>Progress</h3> | <h3>Progress</h3> | ||
| − | The | + | So far, DTI analysis has been tested on a smaller dataset using various fiber tracking tools. The preprocessing is yet to be implemented and the DTI pipeline has to be tested on a larger dataset. |
</div> | </div> | ||
| Line 45: | Line 41: | ||
==References== | ==References== | ||
| − | *Casey B. Goodlett, P. Thomas Fletcher, John H. Gilmore, Guido Gerig. Group Analysis of DTI Fiber Tract Statistics with Application to Neurodevelopment. NeuroImage 45 (1) Supp. 1, 2009. p. S133-S142 | + | *Casey B. Goodlett, P. Thomas Fletcher, John H. Gilmore, Guido Gerig. Group Analysis of DTI Fiber Tract Statistics with Application to Neurodevelopment. NeuroImage 45 (1) Supp. 1, 2009. p. S133-S142. |
</div> | </div> | ||
Revision as of 18:37, 4 January 2010
Home < 2010 Winter Project Week Tractography using DTI Atlasing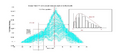
Kernel regression along the fiber tract, also showing the scatter plot for DTI data.
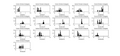
Sub plots showing distribution of FA values in various cross-sections along the fiber tract length.


Key Investigators
- Utah: Gopalkrishna Veni, Ross Whitaker, Sarang Joshi
Objective
To study the effect of drugs on teenagers in the age of 12-30.
Approach, Plan
Initially, the DWI data is preprocessed to address Eddy current correction and EPI distortion correction. Next, DTI Atlas building is performed using Casey’s DTI analysis pipeline* to bring all the DTI images into a common co-ordinate system and then fiber tract analysis is performed to compare the differences in specific fiber tracts. Our aim for the project week is to explore various DTI analysis tools developed by NAMIC to perform tractography.
Progress
So far, DTI analysis has been tested on a smaller dataset using various fiber tracking tools. The preprocessing is yet to be implemented and the DTI pipeline has to be tested on a larger dataset.
References
- Casey B. Goodlett, P. Thomas Fletcher, John H. Gilmore, Guido Gerig. Group Analysis of DTI Fiber Tract Statistics with Application to Neurodevelopment. NeuroImage 45 (1) Supp. 1, 2009. p. S133-S142.