Difference between revisions of "2011 Winter Project Week:NAMICShapeAnalysis"
(Created page with '__NOTOC__ <gallery> Image:PW-SLC2011.png|Projects List Image:genuFAp.jpg|Scatter plot of the original FA data through the genu of the corpus…') |
|||
| (20 intermediate revisions by the same user not shown) | |||
| Line 2: | Line 2: | ||
<gallery> | <gallery> | ||
Image:PW-SLC2011.png|[[2011_Winter_Project_Week#Projects|Projects List]] | Image:PW-SLC2011.png|[[2011_Winter_Project_Week#Projects|Projects List]] | ||
| − | Image: | + | Image:mrml_group.png| Mrml scene for a group test. |
| − | Image: | + | Image:mrml_interaction.png|Mrml scene for an interaction test. |
| + | Image:shapeAnalysisMANCOVA_Wizard-screenshot.png | shapeAnalysisMANCOVA_Wizard-screenshot | ||
</gallery> | </gallery> | ||
==Key Investigators== | ==Key Investigators== | ||
| − | * UNC: Lucile Bompard, Martin Styner | + | * UNC: Lucile Bompard, Clement Vachet, Martin Styner |
* Utah: Chris Gloschat | * Utah: Chris Gloschat | ||
| Line 14: | Line 15: | ||
<h3>Objective</h3> | <h3>Objective</h3> | ||
| − | + | Statistical shape analysis methods have emerged within the last decade to allow for a localized analysis of shape.The UNC shapeAnalysisMANCOVA pipeline is a unified method for local shape analysis that can accommodate different number of variates and contrasts. Unlike current shape analysis frameworks,it also allows to include any number of associated variables in the statistical analysis of the data. | |
| + | This tool has been designed to interact seamlessly with the existing UNC SPHARM-PDM based shape analysis toolbox. Indeed, the point-based models computed with the SPHARM-PDM tool can be used in combination with this pipeline to perform quantitative morphological assessment of structural changes at specific locations. | ||
| + | The aim is to improve this UNC pipeline by integrating the Particle-based Shape Correspondence, and using SPHARM as an initialization. | ||
| Line 26: | Line 29: | ||
<h3>Approach, Plan</h3> | <h3>Approach, Plan</h3> | ||
| + | The developed shapeAnalysisMANCOVA is a C++ program that can be run both with shapeAnalysisMANCOVA_Wizard as well as a command line tool. In order to compile shapeAnalysisMANCOVA, ITK, VTK, GenerateCLP and Boost Libraries for C (v 0.39.1) must already be installed. | ||
| + | The point-based models will be analyzed with methods using multivariate analysis of covariance (MANCOVA). | ||
| + | The steps performed in order to obtain the statistical analysis are the following, for each iteration: | ||
| − | + | computing a General Linear Model (GLM) to test group differences at every surface location, | |
| − | Our plan for the project week is to | + | doing the Metric computation thanks to the Multivariate analysis of covariance (MANCOVA), |
| + | |||
| + | computing the P-values and controlling for the mutliple testing problem, | ||
| + | |||
| + | doing the permutations tests (considering the linear varibles). | ||
| + | |||
| + | The data scenes (MRML scene) are created and can be displayed within 3D Slicer. | ||
| + | |||
| + | Our plan for the project week is to: | ||
| + | * try to get rid of boost library - find similar method in Slicer libraries if possible | ||
| + | * use GenerateCLP to integrate shapeAnalysisMANCOVA_Wizard directly within Slicer3 | ||
| + | * Load MRML scenes created for quality control directly within Slicer | ||
| + | * improve the shapeAnalysisMANCOVA_Wizard | ||
</div> | </div> | ||
| Line 36: | Line 54: | ||
<h3>Progress</h3> | <h3>Progress</h3> | ||
| − | + | shapeAnalysisMANCOVA_Wizard can be use either though command line or within Slicer and whatever the choise, the mrml scene will be displayed in Slicer3 at the end. | |
| + | The shapeAnalysisMANCOVA_Wizard's window is now resizable. | ||
| Line 46: | Line 65: | ||
==Delivery Mechanism== | ==Delivery Mechanism== | ||
| − | This work will be delivered to the NA-MIC Kit as a | + | This work will be delivered to the NA-MIC Kit as a |
#ITK Module | #ITK Module | ||
#Slicer Module | #Slicer Module | ||
##Built-in | ##Built-in | ||
| − | ##Extension -- commandline | + | ##Extension -- commandline YES |
| − | ##Extension -- loadable | + | ##Extension -- loadable YES |
| − | #Other | + | #Other shapeAnalysisMANCOVA_Wizard |
| − | |||
| − | |||
| − | |||
| − | |||
| − | |||
| − | |||
| − | |||
| − | |||
Latest revision as of 15:16, 14 January 2011
Home < 2011 Winter Project Week:NAMICShapeAnalysis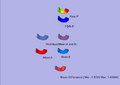
Mrml scene for a group test.
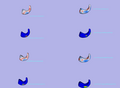
Mrml scene for an interaction test.
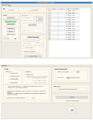
shapeAnalysisMANCOVA_Wizard-screenshot


Key Investigators
- UNC: Lucile Bompard, Clement Vachet, Martin Styner
- Utah: Chris Gloschat
Objective
Statistical shape analysis methods have emerged within the last decade to allow for a localized analysis of shape.The UNC shapeAnalysisMANCOVA pipeline is a unified method for local shape analysis that can accommodate different number of variates and contrasts. Unlike current shape analysis frameworks,it also allows to include any number of associated variables in the statistical analysis of the data. This tool has been designed to interact seamlessly with the existing UNC SPHARM-PDM based shape analysis toolbox. Indeed, the point-based models computed with the SPHARM-PDM tool can be used in combination with this pipeline to perform quantitative morphological assessment of structural changes at specific locations. The aim is to improve this UNC pipeline by integrating the Particle-based Shape Correspondence, and using SPHARM as an initialization.
Approach, Plan
The developed shapeAnalysisMANCOVA is a C++ program that can be run both with shapeAnalysisMANCOVA_Wizard as well as a command line tool. In order to compile shapeAnalysisMANCOVA, ITK, VTK, GenerateCLP and Boost Libraries for C (v 0.39.1) must already be installed. The point-based models will be analyzed with methods using multivariate analysis of covariance (MANCOVA). The steps performed in order to obtain the statistical analysis are the following, for each iteration:
computing a General Linear Model (GLM) to test group differences at every surface location,
doing the Metric computation thanks to the Multivariate analysis of covariance (MANCOVA),
computing the P-values and controlling for the mutliple testing problem,
doing the permutations tests (considering the linear varibles).
The data scenes (MRML scene) are created and can be displayed within 3D Slicer.
Our plan for the project week is to:
- try to get rid of boost library - find similar method in Slicer libraries if possible
- use GenerateCLP to integrate shapeAnalysisMANCOVA_Wizard directly within Slicer3
- Load MRML scenes created for quality control directly within Slicer
- improve the shapeAnalysisMANCOVA_Wizard
Progress
shapeAnalysisMANCOVA_Wizard can be use either though command line or within Slicer and whatever the choise, the mrml scene will be displayed in Slicer3 at the end. The shapeAnalysisMANCOVA_Wizard's window is now resizable.
Delivery Mechanism
This work will be delivered to the NA-MIC Kit as a
- ITK Module
- Slicer Module
- Built-in
- Extension -- commandline YES
- Extension -- loadable YES
- Other shapeAnalysisMANCOVA_Wizard