Difference between revisions of "RT dose comparison tool for Slicer"
From NAMIC Wiki
| (9 intermediate revisions by the same user not shown) | |||
| Line 1: | Line 1: | ||
__NOTOC__ | __NOTOC__ | ||
| − | |||
| − | |||
| − | |||
| − | [[Image: | + | [[Image:panel.png|300px|Slicer 3 GUI panel]] |
| − | [[Image: | + | [[Image:isodose1.png|600px|Isodose lines in Slicer 3]] |
| + | |||
| + | [[Image:gamma_label.png|600px|Image of gamma index in Slicer 3]] | ||
==Key Investigators== | ==Key Investigators== | ||
| Line 15: | Line 14: | ||
<h3>Objective</h3> | <h3>Objective</h3> | ||
| − | We are developing | + | We are developing a tool for analyzing dose distributions. The goal is to be able to make quantitative evaluation of different dose distributions in association with RT structures of interest. |
| Line 28: | Line 27: | ||
<h3>Approach, Plan</h3> | <h3>Approach, Plan</h3> | ||
| − | Our approach for analyzing | + | Our approach for analyzing dose distributions is to create multiple modes of dose difference quantification that complement each other. Simultaneous evaluation of isodoses, dose-difference and distance-to-agreemnet distributions will be used to determine dissimilarities of two dose images. |
| − | |||
</div> | </div> | ||
| Line 36: | Line 34: | ||
<div style="width: 40%; float: left;"> | <div style="width: 40%; float: left;"> | ||
| − | <h3>Progress</h3> | + | <h3>Progress</h3>We created Plastimatch based command line module for Slicer3 titled "Dose comparison" that allows us to create and display isodoses, image dose-difference and distance-to-agreement distributions according to user's needs. Better representation of isodose labelmap is needed to be able to create overlaping isodose surfaces. |
| − | + | ||
| + | |||
| Line 47: | Line 46: | ||
==Delivery Mechanism== | ==Delivery Mechanism== | ||
| − | This work will be delivered to the NA-MIC Kit as a | + | This work will be delivered to the NA-MIC Kit as a |
| + | Extension -- commandline | ||
| − | + | ==References== | |
| − | |||
| − | |||
| − | |||
| − | |||
| − | |||
| − | + | * [http://plastimatch.org/ Plastimatch] | |
| − | * | ||
| − | |||
| − | |||
| − | |||
</div> | </div> | ||
Latest revision as of 22:50, 12 January 2012
Home < RT dose comparison tool for SlicerKey Investigators
- MGH: Nadya Shusharina, Greg Sharp
Objective
We are developing a tool for analyzing dose distributions. The goal is to be able to make quantitative evaluation of different dose distributions in association with RT structures of interest.
Approach, Plan
Our approach for analyzing dose distributions is to create multiple modes of dose difference quantification that complement each other. Simultaneous evaluation of isodoses, dose-difference and distance-to-agreemnet distributions will be used to determine dissimilarities of two dose images.
Progress
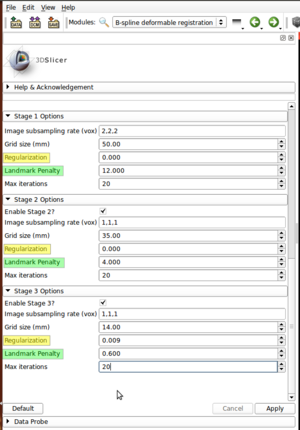
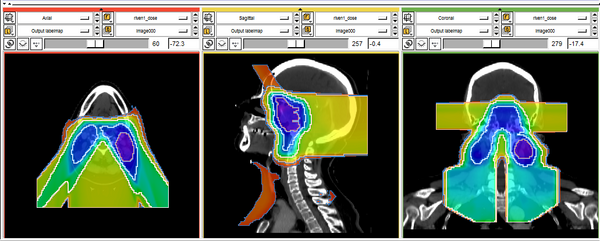
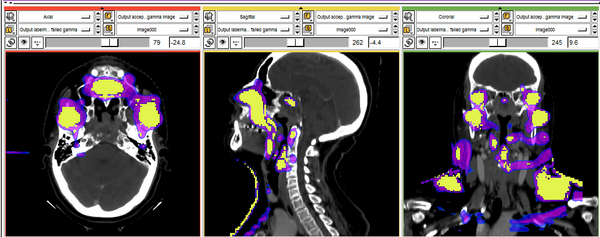
We created Plastimatch based command line module for Slicer3 titled "Dose comparison" that allows us to create and display isodoses, image dose-difference and distance-to-agreement distributions according to user's needs. Better representation of isodose labelmap is needed to be able to create overlaping isodose surfaces.
Delivery Mechanism
This work will be delivered to the NA-MIC Kit as a Extension -- commandline


