Gallery
From NAMIC Wiki
Home < Gallery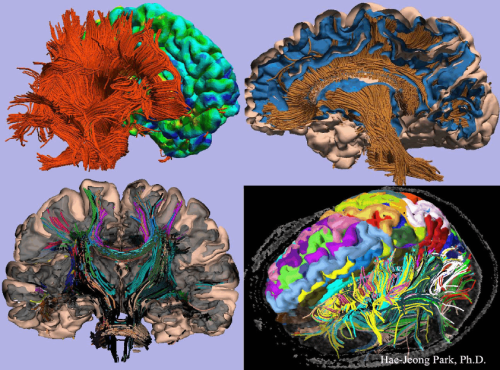
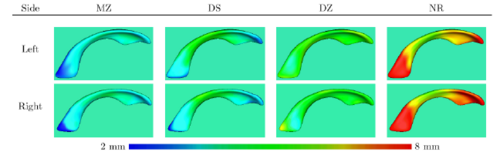
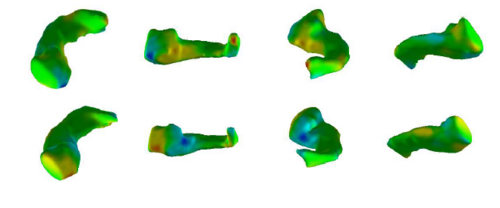
Image Gallery

Upper left panel displays fiber tractography combined with cortical thickness map obtained with Free Surfer. Upper right panel demonstrates a sagittal cross-sectional view of brain parenchyma segmented into white and gray matter combined with fiber tractography map. Lower left figure shows a coronal cross-sectional view of automatic parcellation of white matter overplayed with the gray matter surface. Lower right figure shows the parcellation of gray matter surface and corresponding white matter fibers.

Visualization of variation in ventricle volume for pairs of subjects (MZ – monozygotic twins, DS – monozygotic twins discordant for schizophrenia, DZ – dizygotic twins, NR – nonrelated pairs). The distances are color-coded to show absolute differences between 2 and 8mm. The figures illustrate decreasing shape similarity MZ = DS < DZ < NR. Healthy MZ are not significantly different from MZ discordant for schizophrenia (DS).


Principal deformation for the right hippocampus for normal controls (top) and schizophrenia patients (bottom). Four views (front, lateral, back, medial) of each shape are shown. The color indicates the direction and the magnitude of the deformation, changing from blue (inwards) to green (no deformation) to red (outwards).