ImageArchive/2007
From NAMIC Wiki
Home < ImageArchive < 2007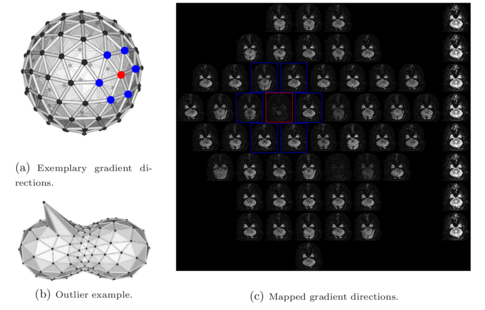
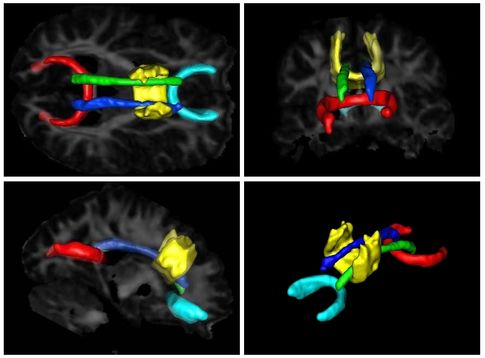
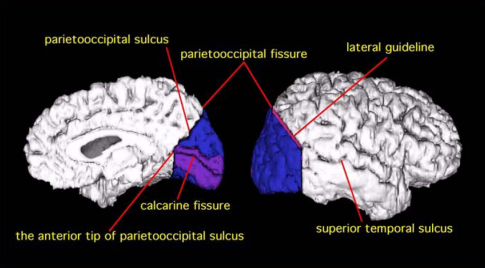
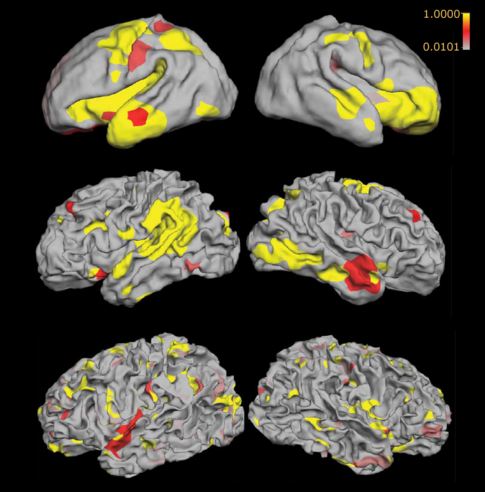
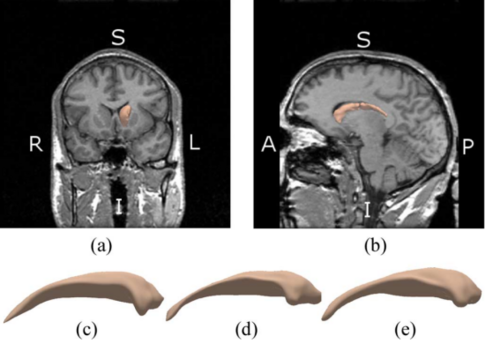
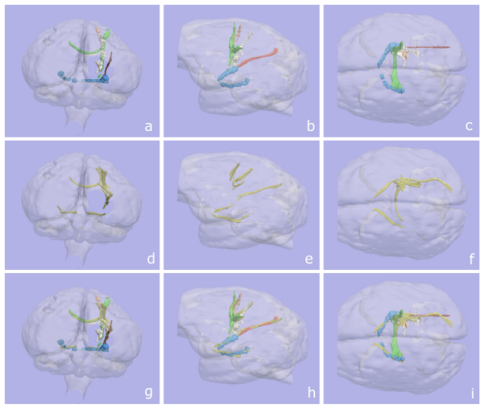
Image Archive 2007
December

Outlier Rejection for Diffusion Weighted Imaging. Outliers for a given gradient direction are assumed to show values inconsistent with the values of neighboring gradient directions (a). This could either be unusually large (b) or unusually small image intensities (c). The extreme example on the right (c) shows large signal drops for complete image slices. Since the method operates on a voxel by voxel basis, outliers may be detected and corrected for complete slices, but also for more confined, localized patches. Read more ...
October

A volumetric approach to quantifying region-to-region white matter connectivity. The paper presents a volumetric approach for quantitatively studying white matter connectivity from diffusion tensor magnetic resonance imaging (DT-MRI). Volumetric pathways for several tracts are displayed. Read more ...
August

Occipital lobe gray matter volume in male patients with chronic schizophrenia. Schizophrenia is characterized by deficits in cognition as well as visual perception. There have been studies of the occipital lobe as an anatomically defined region of interest in schizophrenia. To examine whether or not patients with chronic schizophrenia show occipital lobe volume abnormalities, we measured gray matter volumes for both the primary visual area (PVA) and the visual association areas (VAA). Read more ...
July

Cortical surface shape analysis. Estimated folding development speed of the regions that develop the fastest during age 0-33 weeks (first row), 33-38 weeks (second row), and 38 weeks and older (third row). Colormap encodes the magnitude of the estimated development speed. Read more ...
June

Multiscale 3-D shape representation and segmentation using spherical wavelet. This image shows the location of the caudate nucleus (top) and the variability observed (bottom). Read more ...
May

3D Histological Reconstruction of Fiber Tracts. Three different views of the paths derived from histological slices (a, b, c), the corresponding fiber tracts derived from DTI (d, e, f), and both results displayed together (g, h, i). Read more ...