File list
From NAMIC Wiki
This special page shows all uploaded files.
| Date | Name | Thumbnail | Size | Description | Versions |
|---|---|---|---|---|---|
| 15:48, 22 June 2011 | NA-MIC-VTK-Charts-2011.pdf (file) | 14.09 MB | The slides that were presented by Marcus Hanwell at project week summer 2011. Please note that full examples of code shown in the slides is available in the VTK repository (Charts/Testing/) in the Cxx and Python subdirectories. These are tested and buil | 1 | |
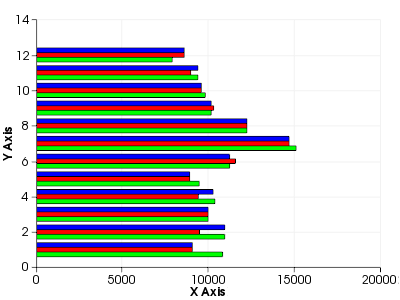
| 21:32, 17 June 2011 | VTK-Charts-BarGraphHorizontal.png (file) |  |
8 KB | Example of horizontal bar chart from VTK. | 1 |
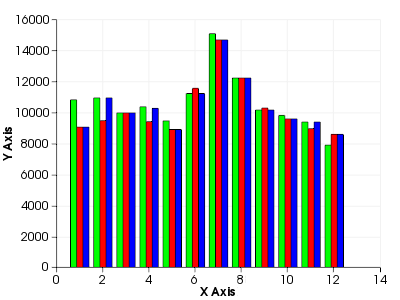
| 21:31, 17 June 2011 | VTK-Charts-BarGraph.png (file) |  |
10 KB | Example of typical vertical bar chart from VTK, using grouping of bars. | 1 |
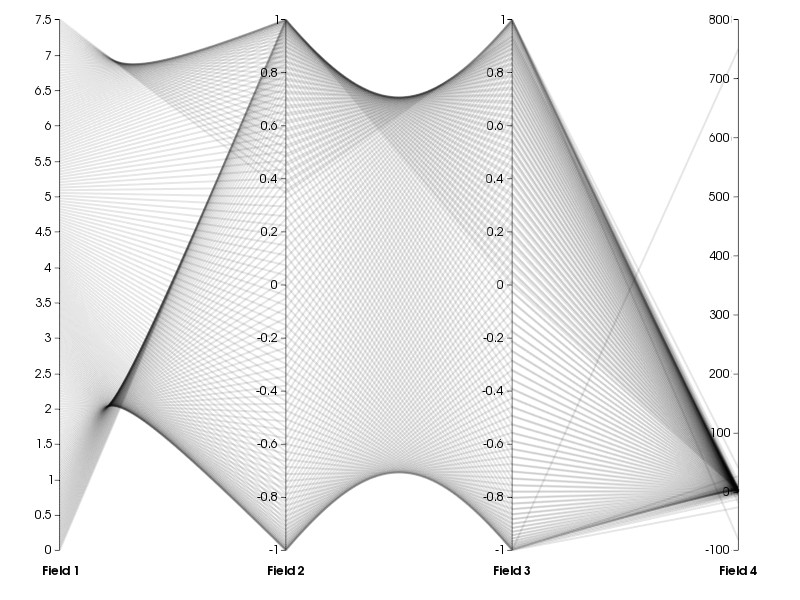
| 21:29, 17 June 2011 | VTK-Charts-ParallelCoordinates.png (file) |  |
286 KB | Parallel coordinates from VTK charts. | 1 |
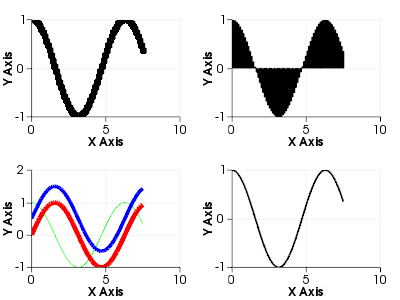
| 21:28, 17 June 2011 | VTK-Charts-PlotMatrix.png (file) |  |
15 KB | An example of a 2x2 matrix of charts in VTK. | 1 |
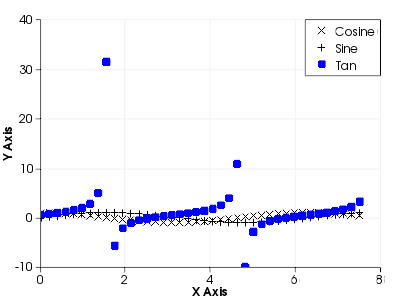
| 21:27, 17 June 2011 | TestScatterPlot.png (file) |  |
10 KB | VTK scatter plot example with legend. | 1 |
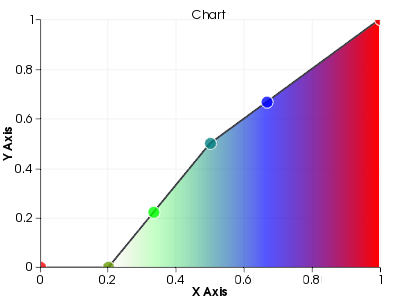
| 21:26, 17 June 2011 | VTK-Charts-ScalarsToColors.png (file) |  |
13 KB | Scalars to colors chart example from VTK. | 1 |
| 21:25, 17 June 2011 | VTK-Charts-StackedPlot.png (file) |  |
14 KB | Stacked area plot from VTK charts. | 1 |
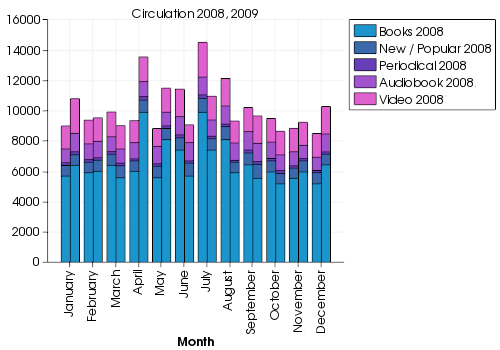
| 21:24, 17 June 2011 | VTK-Charts-StackedBarGraph.png (file) |  |
22 KB | Stacked bar graphs from VTK. | 1 |
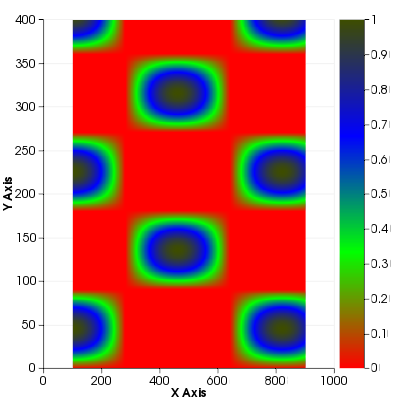
| 21:20, 17 June 2011 | VTK-Charts-Histogram2D.png (file) |  |
51 KB | A VTK chart showing a 2D histogram. | 1 |
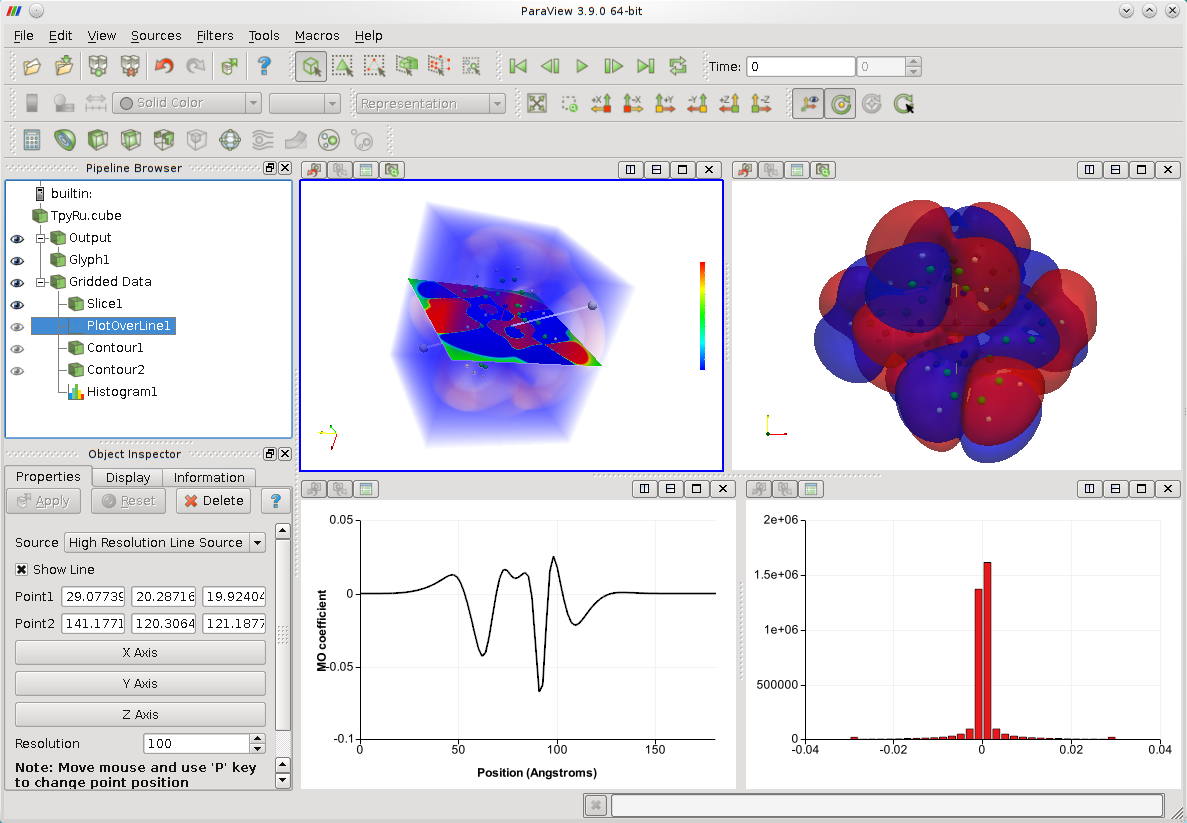
| 19:24, 17 June 2011 | Vtk-charts-ParaViewTpyRu.png (file) |  |
216 KB | Example of the VTK charts in use in a ParaView session looking at molecular data. | 1 |
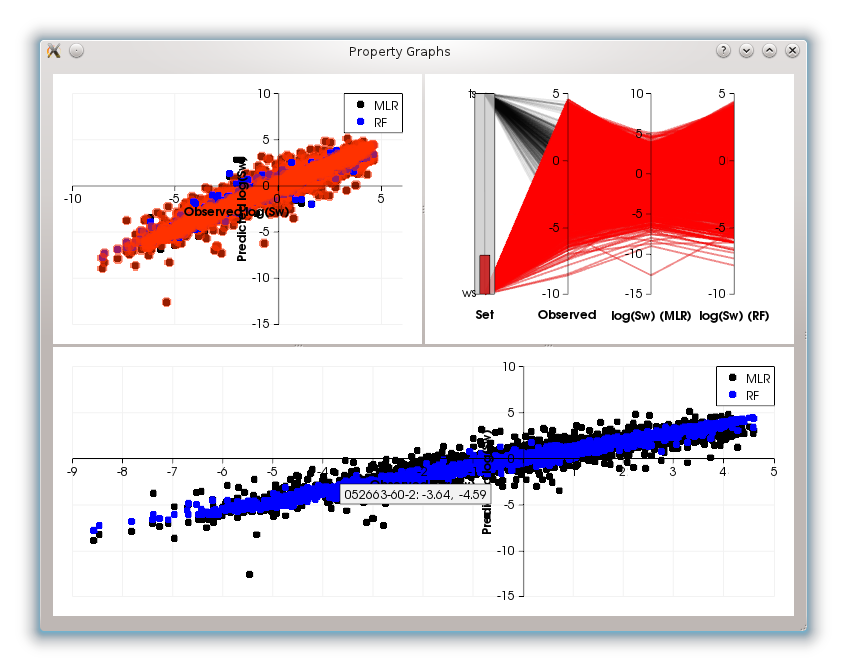
| 19:12, 17 June 2011 | Vtk-charts-chemdata-graphs.png (file) |  |
88 KB | Example of linked selection using a scatter plot (top-left), parallel coordinates (top-right) controlling selection, and a second scatter plot showing a subset of the data (bottom). | 1 |