UNC MANCOVA Tutorial
Contents
shapeAnalysisMANCOVA_Wizard
Overview
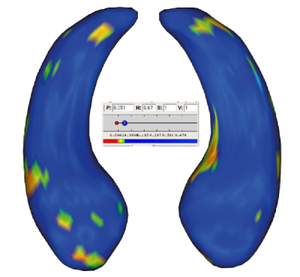
shapeAnalysisMANCOVA offers statistical shape analysis based on a parametric boundary description (SPHARM) as the point-based model computing method. The point-based models will be analyzed with the methods here proposed using multivariate analysis of covariance (MANCOVA). Here, the number of variates being tested is the dimensionality of our observations. Each point of these observations is a three dimensional displacement vector from the mean. The number of contrasts is the number of equations involved in the null-hypothesis. In order to encompass varying numbers of variates and contrasts, and to account for independent variables, a matrix computation is performed. This matrix represents the multidimensional aspects of the correlation significance and it can be transformed into a scalar measure by manipulation of its eigenvalues.
- Step by step analysis: With this tutorial you will learn how to run shapeAnalysisMANCOVA using shapeAnalysisMANCOVA_Wizard tutorial. With this graphic interface, you will be able to load meshes, run a group test in order to get statistical results, displayed through MRML scene.
Tutorials
shapeAnalysisMANCOVA_Wizard tutorial : to perform statistical shape analysis. [ppt] [pdf]
Software
Slicer3 External modules -including BatchMake Description files
Tutorial materials
ShapeAnalysisMANCOVA_Wizard data : NB: You can also use the output file of ShapeAnalysisModule.
- Link to NITRC
- or directly here : ShapeAnalysisMANCOVA_WizardTutorialData_TutorialContestSummer2011.zip
Complementary documentation
- Paniagua B., Styner M., Macenko M., Pantazis D., Niethammer M, Local Shape Analysis using MANCOVA, Insight Journal, 2009 July-December, http://hdl.handle.net/10380/3124
People
Lucile Bompard
Clement Vachet
Beatriz Paniagua
Martin Styner
