2013 Project Week:4DShapeAnalysis
Shape evolution of sub-cortical structures.


Key Investigators
- James Fishbaugh, Marcel Prastawa, Guido Gerig, SCI
- Hans Johnson, Iowa
Project Description
Objective
In past project weeks, we have explored the application of shape regression to study sub-cortical changes associated with Huntington's disease. This has led to the development and release of open source shape analysis software. During this project week, we would like to investigate a new algorithm recently developed for our software. The method is the extension of linear regression to shapes, where we jointly estimate a baseline shape (intercept) and initial momenta vectors (slope) which define the dynamics of shape change over time. This is in contrast to the current implementation, which assumes the baseline shape is fixed at the earliest time point.
Approach, Plan
- Individual regression with control points at shared locations
- Compare to previous results
- Compare differences between HD subjects and controls
Progress
Segmentation
Here we consider a multi-shape complex of caudate, putamen, and thalamus, which were provided as binary images. Triangular meshes were extracted using marching cubes, giving us 3 shapes at 3 time points for each subject.
Regression
The continuous evolution of all 3 structures is estimated jointly, using a shared control point parameterization.
Conclusion
- As before, segmentation quality is the most important factor in the analysis. The changes we are interested in detecting could potentially be of the same order as segmentation error.
- Estimating the baseline shape may improve the robustness of the estimation,
- However, we need to be careful about the estimation of the baseline shape. The changes over time are very subtle, therefore small differences in the baseline shape could lead to completely different dynamics of shape change.
Summary
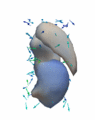
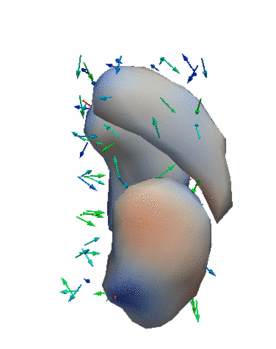
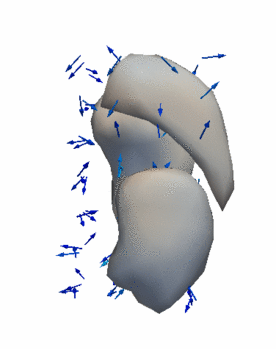
Initialization of baseline sub-cortical shapes, which defines the number of shape points as well as topology.
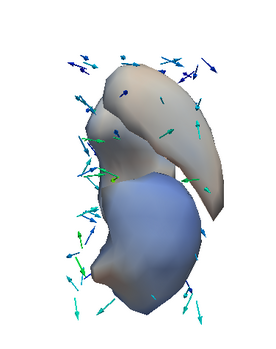
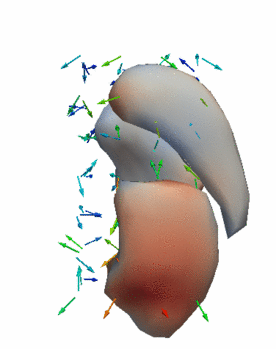
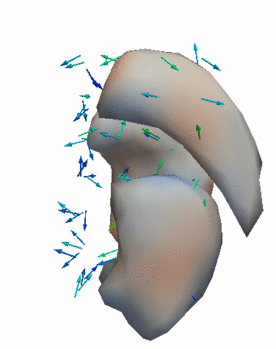
Regression results with estimated baseline shapes (intercept) and initial momenta vectors (slope). Color on the surface denotes contraction (blue) and expansion (red).


Volume analysis after regression
Here we measure the volume of the estimated baseline shape as well as the volume of the estimated shape at the final time point. We show the volume estimated from regression as well as the observed volume in parentheses. Recall that there is also a third observation somewhere in between the initial and final time point that also influences estimation. Finally, note that the estimation is performed jointly on all shapes simultaneously.
HD Subjects
| Shape | Initial Volume (mm^3) | Final Volume (mm^3) | Percent Change | |
|---|---|---|---|---|
| Subject 10001 | Caudate | 2298 (2338) | 2289 (2266) | -0.39% |
| Putamen | 3042 (2815) | 2894 (2743) | -4.86% | |
| Thalamus | 6384 (6270) | 5961 (5685) | -6.63% | |
| Subject 10018 | Caudate | 3059 (3261) | 3065 (3091) | 0.20% |
| Putamen | 3521 (3468) | 3416 (3375) | -2.98% | |
| Thalamus | 6992 (7214) | 7449 (7568) | 6.54% | |
| Subject 10027 | Caudate | 2397 (2330) | 2352 (2296) | -1.88% |
| Putamen | 3194 (3091) | 2993 (2846) | -6.29% | |
| Thalamus | 7278 (6959) | 7287 (7291) | 0.12% |
Controls
| Shape | Initial Volume (mm^3) | Final Volume (mm^3) | Percent Change | |
|---|---|---|---|---|
| Subject 10016 | Caudate | 4015 (4154) | 4051 (4195) | 0.90% |
| Putamen | 4750 (4526) | 4741 (4778) | -0.19% | |
| Thalamus | 8088 (8406) | 8049 (8058) | -0.48% | |
| Subject 10017 | Caudate | 2094 (1760) | 2093 (2120) | -0.05% |
| Putamen | 3871 (3275) | 3879 (3887) | 0.21% | |
| Thalamus | 5915 (5531) | 5846 (5752) | -1.17% |
Regression results
- HD Subjects

Subject 10001. Putamen volume decreased ~5%, thalamus volume decreased ~6.5%.
Subject 10018. Putamen volume decreased by ~3%, thalamus volume increased by 6.5%.
Subject 10027. Putamen volume decreased by ~6.5%.


- Control Subjects
Subject 10016. All volume changes were less than 1%.
Subject 10017. Caudate and putamen changed in volume less that 1%. Thalamus volume decreased by ~1%.

